
Analysis in Brief
Enduring effects of the pandemic: The case of the passenger car rental industry in New Brunswick
Skip to text
Text begins
As the COVID-19 pandemic ran its course, Canada’s tourism sector experienced a surge in demand because of the easing of travel restrictions and the opening of land borders. However, the influx of travellers during the peak travel season in the summer of 2022 created significant challenges for service providers. Labour shortages and challenges with supply chains were also key factors. The supply-constrained vehicle industry has impacted households and businesses since the start of the pandemic. The passenger car rental industry is still struggling to replenish its inventories three years into the pandemic as difficulties persist in purchasing new vehicles from automakers.Note Motor vehicle manufacturing levels in Canada were still more than one-quarter lower in 2022 than in 2019,Note because of shortages of components like semiconductor chips. The pandemic continues to have lingering impacts on the passenger car rental industry.This study examined provincial motor vehicle registration data to provide new estimates on rental car fleets in New Brunswick from 2010 to 2022, with a special focus on the turnover and management of inventories during the pandemic. A first analysis presented the rental car fleets for British Columbia over a similar period.
Despite tourism activity approaching pre-pandemic levels in New Brunswick, the rental car fleet remains significantly below the levels attained before the pandemic. Fleet inventories grew in 2022 but still have a long recovery to fulfill pent-up demand. This had implications for the industry. Non-traditional rental car options, such as peer-to-peer car sharing programs, are expanding in urban centres. Car rental businesses were also not turning over inventories as quickly in the past two years. Rental car businesses have been keeping new cars in their inventory for one and a half to two years, a longer amount of time compared with before the pandemic, when they kept new cars for around one year. Inflationary pressures remain elevated for car rentals.
Context for the tourism sector in New Brunswick as the pandemic continued in 2022
The COVID-19 pandemic had a significant impact on the tourism sector in the Atlantic provinces in 2020 and 2021 as restrictions in the Atlantic bubble hampered domestic and international travel. Subsequently, tourism activity turned around rapidly in New Brunswick in the summer of 2022 as the Canadian economy and many foreign countries adjusted. The number of tourists in New Brunswick, however, has not reached the pre-pandemic levels of 2019. Indicators related to tourism in New Brunswick during the 2022 peak travel season (May to September) show that tourism activity was about 20% below the levels reached over the same period in 2019 (Chart 1).Note Nevertheless, it was higher than during the first two years of the pandemic (2020 and 2021).
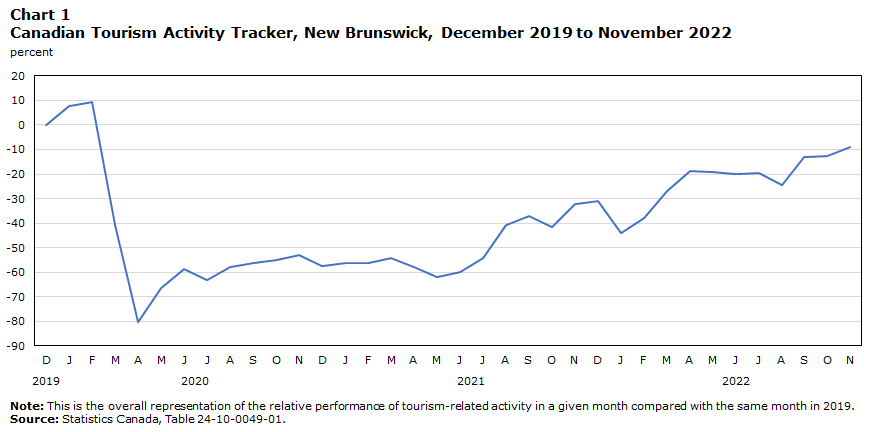
Data table for Chart 1
| Percent | ||
|---|---|---|
| 2019 | December | 0.0 |
| 2020 | January | 7.5 |
| February | 9.2 | |
| March | -40.6 | |
| April | -80.2 | |
| May | -66.4 | |
| June | -58.7 | |
| July | -63.1 | |
| August | -58.0 | |
| September | -56.4 | |
| October | -55.0 | |
| November | -53.0 | |
| December | -57.6 | |
| 2021 | January | -56.2 |
| February | -56.2 | |
| March | -54.2 | |
| April | -58.0 | |
| May | -61.9 | |
| June | -59.9 | |
| July | -54.2 | |
| August | -41.0 | |
| September | -37.3 | |
| October | -41.6 | |
| November | -32.2 | |
| December | -31.0 | |
| 2022 | January | -44.1 |
| February | -37.8 | |
| March | -26.9 | |
| April | -18.9 | |
| May | -19.1 | |
| June | -19.9 | |
| July | -19.6 | |
| August | -24.3 | |
| September | -13.2 | |
| October | -12.9 | |
| November | -9.1 | |
|
Note: This is the overall representation of the relative performance of tourism-related activity in a given month compared with the same month in 2019. Source: Statistics Canada, Table 24-10-0049-01. |
||
In the spring and summer of 2022, the total number of international arrivals to New Brunswick reached nearly half the level of the same period in 2019,Note a vast improvement compared with 2020 and 2021 (Chart 2). These developments provided a boost to the tourism industry.
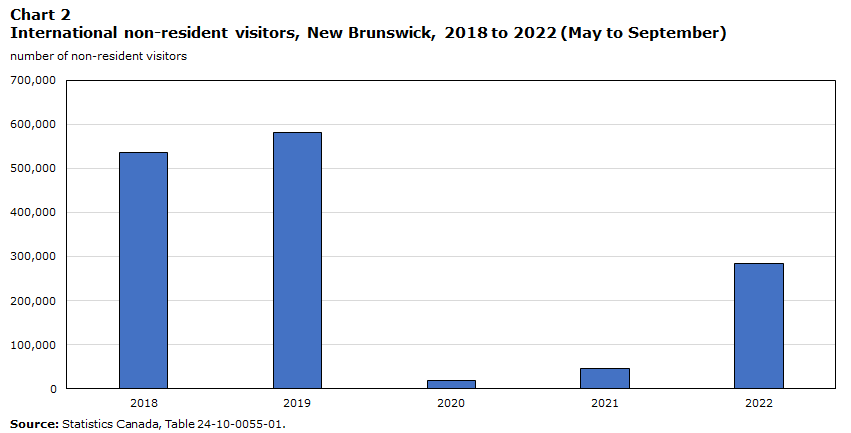
Data table for Chart 2
| number of non-resident visitors | |
|---|---|
| 2018 | 535,291 |
| 2019 | 582,045 |
| 2020 | 19,514 |
| 2021 | 46,861 |
| 2022 | 284,789 |
| Source: Statistics Canada, Table 24-10-0055-01. | |
Macroeconomic factors weighing on tourism service providers
Despite a rebound in the number of visitors to New Brunswick, several macroeconomic factors impacted the pace and the extent of the recovery for tourism service providers, including the passenger car rental industry. New Brunswick had a tight labour market as the job vacancy rate increased from close to 3% in 2019 to 4.4% in 2022. The highest job vacancy rates in Canada were in the accommodation and food services sector. This was also the case in New Brunswick (Chart 3).Note

Data table for Chart 3
| Canada, all industries | Canada, accommodation and food services | New Brunswick, all industries | New Brunswick, accommodation and food services | |
|---|---|---|---|---|
| percent | ||||
| 2019 | 3.2 | 4.8 | 3.0 | 5.5 |
| 2020 | 3.3 | 4.4 | 3.5 | 5.3 |
| 2021 | 4.7 | 9.5 | 4.2 | 8.4 |
| 2022 | 5.6 | 10.6 | 4.8 | 10.2 |
|
Notes: Data for the second and third quarters of 2020 were unavailable because some of Statistics Canada's operations were temporarily suspended during the COVID-19 pandemic. Data for 2022 are up to the third quarter. Source: Statistics Canada, Table 14-10-0326-01. |
||||
With pent-up demand for services as the economy functioned without COVID-19 restrictions, prices consumers paid for services rose twice as fast in 2022 (+4.1%)Note as in 2021. Consumers in New Brunswick, including out-of-province visitors, paid more for hotel rooms, restaurant meals and passenger car rentals. Prices for traveller accommodations increased 24.0% on an annual average basis in 2022, while prices had remained stable in 2021. Higher annual average prices for food purchased from restaurants (+6.1%) in 2022 also contributed to inflationary pressures in the service sector. However, some of the steepest price increases in the last two years were from businesses in the passenger car rental industry. Nationally, prices for rental of passenger vehicles have risen by nearly 50% since 2019 (Chart 4). The cost pressures associated with the maintenance and repair of existing vehicles and the acquisition of new vehicles have impacted rental car businesses.Note

Data table for Chart 4
| All items | Rental of passenger cars | |
|---|---|---|
| percentage change | ||
| 2010 | 1.8 | -1.4 |
| 2011 | 2.9 | 2.9 |
| 2012 | 1.5 | 0.4 |
| 2013 | 0.9 | 3.4 |
| 2014 | 2.0 | -0.4 |
| 2015 | 1.1 | -3.4 |
| 2016 | 1.4 | 3.5 |
| 2017 | 1.6 | -3.6 |
| 2018 | 2.3 | 3.4 |
| 2019 | 1.9 | 6.9 |
| 2020 | 0.7 | -1.6 |
| 2021 | 3.4 | 31.9 |
| 2022 | 6.8 | 11.8 |
| Source: Statistics Canada, Table 18-10-0005-01. | ||
While imbalances in labour markets and supply chains weighed on tourism service providers, including passenger car rental businesses, the growth in the economy (Chart 5) was beneficial to the business demand for car rentals.Note
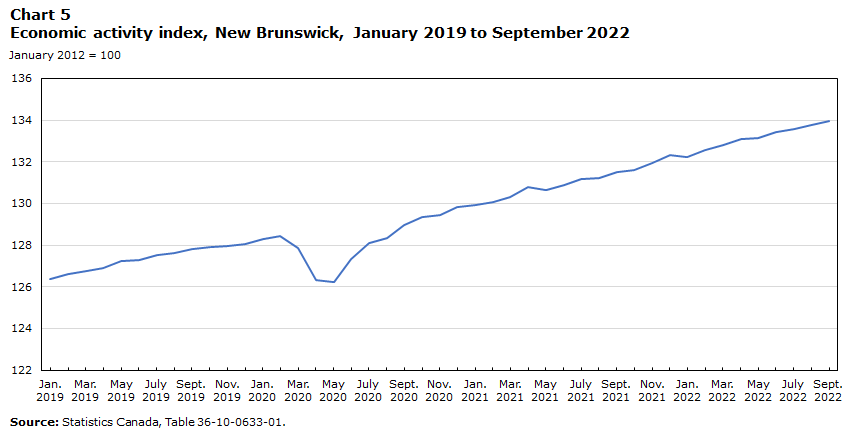
Data table for Chart 5
| January 2012 = 100 | ||
|---|---|---|
| 2019 | January | 126.38 |
| February | 126.61 | |
| March | 126.74 | |
| April | 126.91 | |
| May | 127.22 | |
| June | 127.28 | |
| July | 127.53 | |
| August | 127.63 | |
| September | 127.82 | |
| October | 127.91 | |
| November | 127.94 | |
| December | 128.05 | |
| 2020 | January | 128.28 |
| February | 128.42 | |
| March | 127.87 | |
| April | 126.31 | |
| May | 126.21 | |
| June | 127.34 | |
| July | 128.11 | |
| August | 128.32 | |
| September | 128.99 | |
| October | 129.33 | |
| November | 129.47 | |
| December | 129.83 | |
| 2021 | January | 129.94 |
| February | 130.07 | |
| March | 130.33 | |
| April | 130.77 | |
| May | 130.64 | |
| June | 130.91 | |
| July | 131.16 | |
| August | 131.20 | |
| September | 131.50 | |
| October | 131.60 | |
| November | 131.92 | |
| December | 132.35 | |
| 2022 | January | 132.21 |
| February | 132.58 | |
| March | 132.82 | |
| April | 133.11 | |
| May | 133.16 | |
| June | 133.42 | |
| July | 133.56 | |
| August | 133.75 | |
| September | 133.94 | |
| Source: Source: Statistics Canada, Table 36-10-0633-01. | ||
A larger portion of car rental operations cater to business clients than households (Chart 6).Note

Data table for Chart 6
| Businesses | Individuals and households | Governments, not-for-profit organizations and public institutions | Outside Canada | |
|---|---|---|---|---|
| 2021 | 60.5% | 34.5% | 3.7% | 1.3% |
|
Note: This is for the North American Industry Classification System category 5321, automotive equipment rental and leasing. This industry group comprises establishments primarily engaged in renting or leasing vehicles, such as passenger cars and passenger vans, as well as trucks, truck tractors, buses, semi-trailers, utility trailers and recreational vehicles, without drivers. Source: Statistics Canada, Table 21-10-0014-01. |
||||
New Brunswick’s rental car fleet
The rental car fleet estimates for New Brunswick were derived from vehicle registration data. For businesses operating in the passenger car rental industry, vehicle identification numbers were tracked over time to see how long vehicles were registered to a particular business (for further information on the methodology, see Note to readers).
Before the pandemic, the rental car fleet in New Brunswick had not been expanding. Between 2017 and 2019, inventories had declined by an annual average of 8.5% (Chart 7). However, with the pandemic came a much larger curtailment of inventories at a time when consumer and business demand was severely hindered, and cost-saving measures were favoured. The rental car fleet in New Brunswick was cut by more than 40% in 2020. Rental car inventories averaged a little over 2,700 vehicles in 2019, then dropped to just below 1,600 vehicles, on average, in 2020. This brought inventories back down to their lowest levels in over a decade.
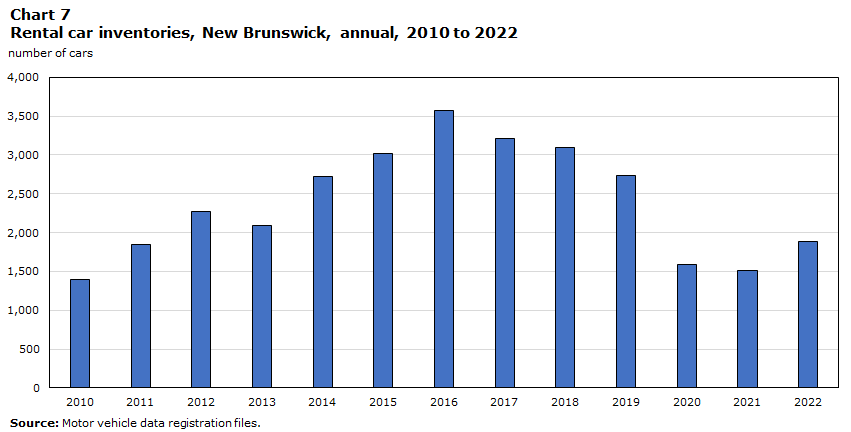
Data table for Chart 7
| Number of cars | |
|---|---|
| 2010 | 1,402 |
| 2011 | 1,844 |
| 2012 | 2,272 |
| 2013 | 2,089 |
| 2014 | 2,726 |
| 2015 | 3,024 |
| 2016 | 3,575 |
| 2017 | 3,218 |
| 2018 | 3,093 |
| 2019 | 2,734 |
| 2020 | 1,596 |
| 2021 | 1,517 |
| 2022 | 1,884 |
| Source: Motor vehicle data registration files. | |
After reaching their lowest levels in the latter part of 2020, rental car inventories remained at low levels in 2021 despite improvements in the tourism sector and the broader economy. Rental car inventories started to rise again in 2022, by more than 20%. Near the end of 2022, inventories had reached close to 2,000 rental cars (Chart 8). However, despite this growth, inventories are still below their pre-pandemic levels. In 2022, inventories were 31% lower than their average levels in 2019.
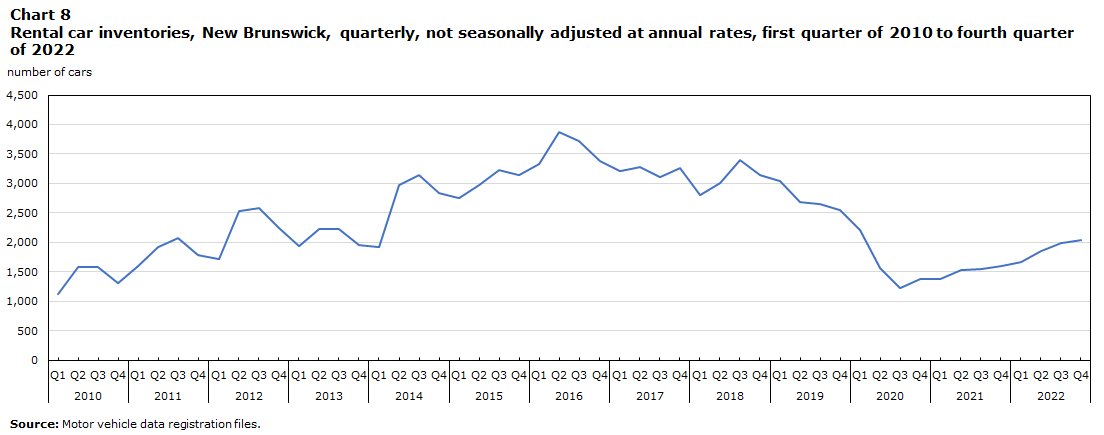
Data table for Chart 8
| Number of cars | ||
|---|---|---|
| 2010 | Quarter 1 | 1,120 |
| Quarter 2 | 1,580 | |
| Quarter 3 | 1,592 | |
| Quarter 4 | 1,317 | |
| 2011 | Quarter 1 | 1,595 |
| Quarter 2 | 1,927 | |
| Quarter 3 | 2,068 | |
| Quarter 4 | 1,785 | |
| 2012 | Quarter 1 | 1,722 |
| Quarter 2 | 2,539 | |
| Quarter 3 | 2,582 | |
| Quarter 4 | 2,246 | |
| 2013 | Quarter 1 | 1,939 |
| Quarter 2 | 2,232 | |
| Quarter 3 | 2,230 | |
| Quarter 4 | 1,954 | |
| 2014 | Quarter 1 | 1,931 |
| Quarter 2 | 2,977 | |
| Quarter 3 | 3,149 | |
| Quarter 4 | 2,847 | |
| 2015 | Quarter 1 | 2,753 |
| Quarter 2 | 2,968 | |
| Quarter 3 | 3,235 | |
| Quarter 4 | 3,139 | |
| 2016 | Quarter 1 | 3,328 |
| Quarter 2 | 3,876 | |
| Quarter 3 | 3,713 | |
| Quarter 4 | 3,382 | |
| 2017 | Quarter 1 | 3,206 |
| Quarter 2 | 3,287 | |
| Quarter 3 | 3,108 | |
| Quarter 4 | 3,270 | |
| 2018 | Quarter 1 | 2,808 |
| Quarter 2 | 3,016 | |
| Quarter 3 | 3,405 | |
| Quarter 4 | 3,142 | |
| 2019 | Quarter 1 | 3,038 |
| Quarter 2 | 2,693 | |
| Quarter 3 | 2,660 | |
| Quarter 4 | 2,543 | |
| 2020 | Quarter 1 | 2,216 |
| Quarter 2 | 1,562 | |
| Quarter 3 | 1,225 | |
| Quarter 4 | 1,379 | |
| 2021 | Quarter 1 | 1,372 |
| Quarter 2 | 1,536 | |
| Quarter 3 | 1,555 | |
| Quarter 4 | 1,605 | |
| 2022 | Quarter 1 | 1,661 |
| Quarter 2 | 1,855 | |
| Quarter 3 | 1,988 | |
| Quarter 4 | 2,033 | |
| Source: Motor vehicle data registration files. | ||
New trends have emerged over the pandemic as difficulties in replenishing inventories have meant that car rental businesses are not turning over inventories as quickly as in past years and are keeping their vehicles longer. In the three years leading up to 2019, car rental businesses kept their vehicles for about one year, on average, before selling them off. However, since the start of the pandemic, car rental businesses have kept new vehicles for an average of one and a half to two years.
Implications and conclusion
Coming out of the pandemic, the combination of supply chain issues, inflationary pressures, tight labour markets and pent-up travel demand has impacted car rental companies in many ways. Rental companies are rebuilding their fleets amid a global shortage of semiconductor chips and new vehicles. However, while the last travel border restrictions and measures have been fully lifted for anyone entering Canada, rental car inventories are not back to their pre-pandemic levels.
The car rental industry is currently going through transformations as it struggles to scale up operations as quickly as demand is rebounding. Non-traditional rental car options, such as peer-to-peer car sharing programs,Note are expanding. Apps and platforms are facilitating the rental of personal vehicles or rental rates by the hour instead of by the day.Note Although these initiatives are growing quickly, they currently represent a smaller share of the industry, and expansion is focused on larger urban areas.Note Car sharing is also growing fast on Canada’s East Coast and is being established in all four Atlantic provinces.Note
Furthermore, there is greater availability of zero-emission rental cars because of growing consumer demandNote for more environmentally friendly vehicles. Close to 10% of new motor vehicle registrations in Canada in the third quarter of 2022 were for zero-emission vehicles, up from 5% a year earlier.Note
Note to readers
Rental car fleet estimates were derived from vehicle registration data. For businesses operating in the passenger car rental industry, vehicle identification numbers (VINs) were tracked over time to estimate how long the vehicles were registered to a particular business. To extract the detailed characteristic information from the VIN for each vehicle manufactured for sale in Canada, a special software was used to decode the VINs.
Specific information about a car was extracted, including make, model and year; where the vehicle was manufactured; and ownership transfers. In general, the ownership transfer information helps establish when a vehicle changes hands, including transfers within the rental car industry.
Reference
New Motor Vehicle Registration Survey (NMVRS), https://www23.statcan.gc.ca/imdb/p2SV.pl?Function=getSurvey&SDDS=5307
- Date modified: