
Analysis in Brief
The Canadian Research and Development Pharmaceutical Sector, 2019
Skip to text
Text begins
Executive summary
This study examines the economic footprint of the Canadian research and development (R&D) pharmaceutical sector on the Canadian economy in 2019, with a focus on the contribution of the members of Innovative Medicines Canada (IMC). The study builds upon findings published for the 2018 reference year with a similar vision – to create a better understanding of the importance of the sector to the Canadian economy and profiles, among other things, the value generated, the jobs supported and the investments made by the sector.
In addition to the important work of furthering medical research, the more than 200 companies in this sector added $15 billion in value added (gross domestic product) to the Canadian economy, supported over 100,000 full-time equivalent (FTE) jobs within Canada, exported more than $5.9 billion worth of goods, and spent between $1.6 billion and $2.2 billion on R&D in 2019. IMC members generated over half of the sector’s value added, with an economic impact of $8.1 billion within Canada. IMC members also directly employed more than 24,800 FTE jobs and supported an additional 30,500 FTE Canadian jobs.
The R&D pharmaceutical sector is important to Canadians and the Canadian economy. This study demonstrates this importance and serves as a foundation upon which further industry research can be carried out.
1. Introduction
The COVID 19 pandemic has put a greater focus on the critical role played by the Canadian research and development (R&D) pharmaceutical sector in advancing healthcare both in Canada and around the world. Companies in the sector perform R&D as a means to discover, develop and administer new medicines and vaccines to prevent, treat and cure diseases and to fight viruses. The sector further supports R&D in Canada by fostering collaborations and partnerships with Canadian hospitals, universities and other organizations.
While the sector plays a significant role in the health and well-being of Canadians, it also has a strong presence in the Canadian economy.
The purpose of this study is to build upon previous research by examining the impacts of the R&D pharmaceutical sector in Canada for 2019, the most recent year for which detailed information is available for the sector. The study includes over 200 companies that make up the Canadian R&D pharmaceutical sector, with a focus on IMC's members which represent Canada's largest innovative pharmaceutical companies. The sector is comprised mostly of three core industries: pharmaceutical and medicine manufacturers; pharmaceuticals and pharmacy supplies merchant wholesalers; and R&D performers in the physical, engineering and life sciences.Note As the R&D pharmaceutical sector is a cross section of several sectors, it should be noted that companies that focus primarily on medical devices, generic pharmaceuticals, or veterinary medicines fall outside the scope of this study.
Several key indicators will be used to measure the economic footprint of the R&D pharmaceutical sector, including IMC's members. These include value added (gross domestic product), employment, R&D activities (both in-house and outsourced), financial statistics and international trade.
2. The Canadian research and development pharmaceutical sector
2.1 Economic footprint
2.1.1 Value added
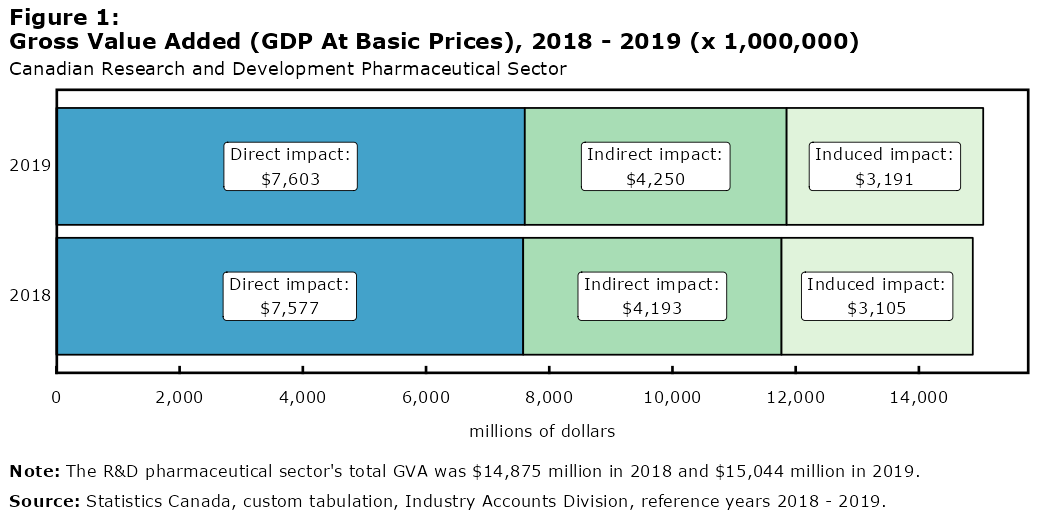
Sector contributed over $15 billion in direct value added to the Canadian economy
Gross value added (GVA) describes the unduplicated monetary contribution that a sector makes to a country’s economic output as measured by its GDP. An industry’s direct impact is measured through its production, while its indirect impact refers to the value added by providing intermediate inputs to the goods and services produced by other economic actors. In addition, an induced impact on the economy can be measured through purchases made from labour income earned by those working in the sector.
In 2019 the R&D pharmaceutical sector contributed a total GVA of $15.0 billion, a 1.1% increase from the $14.9 billion the sector generated in 2018. Of this total impact, about half ($7.6 billion) was generated through the direct production activities of the sector. The increase in GVA was attributable to small increases in the direct and indirect impacts of the sector ($26 million and $57 million, respectively), as well as a large increase in its induced impact ($86 million). In total, the sector accounted for approximately the same percentage (0.7%) of Canada’s GDP at basic prices in 2019 as it did in 2018.Note
Description of figure 1
| 2019 | 2018 | |
|---|---|---|
| millions of dollars | ||
| Direct impact | 7,603 | 7,577 |
| Indirect impact | 4,250 | 4,193 |
| Induced impact | 3,191 | 3,105 |
|
Note: The R&D pharmaceutical sector's total GVA was $14,875 million in 2018 and $15,044 million in 2019. Source: Statistics Canada, custom tabulation, Industry Accounts Division, reference years 2018 - 2019. |
||
The sector’s total impact on outputNote (sales and services revenues) increased $462 million from 2018 to 2019, reaching $28.4 billion. The increase was tied to a rise ($238 million) in the direct output from the sector’s production activities. Indirect and induced output saw smaller increases as well ($75 million and $150 million, respectively).
Sector reported $30.1 billion in operating revenue
During 2019, operating revenue from R&D pharmaceutical companies accounted for $30.1 billion, or 0.7% of all operating revenue in Canada.Note This represents a slight increase from 2018 where the sector generated approximately $30.0 billion. The total operating profits from the sector were $426 million in 2019.
While revenue increased marginally, operating expenses across the sector increased by $1.6 billion in 2019, reaching $29.7 billion. The increase in spending on goods, services, and materials accounted for 64.3% of the total increase, while wages, salaries, and benefits accounted for 19.5%. As a result of the increase in operating expenses compared to revenues, the sector’s operating profit margin fell to 1.4% in 2019, from 6.2% in 2018. Despite the decline in profit margins, businesses in the sector increased their R&D expenditures.
2.1.2 Employment
Over 100,000 Canadian jobs were supported by the sector
Aside from contributing $15 billion in total gross value to Canada’s economy, the direct activities of the R&D pharmaceutical sector supported approximately 46,400 full-time equivalent (FTE) jobs in 2019. Factoring in additional jobs that the sector indirectly supported or induced, the R&D pharmaceutical sector supported over 102,000 FTE jobs in the country in 2019, a 2.1% decline from 2018.
Approximately 45.2% of this decline (1,019 FTEs) was tied to jobs directly supported by firms in the sector, with indirect (930 FTEs) and induced (304 FTEs) jobs contributing the remaining losses.

Description of figure 2
| 2019 | 2018 | |
|---|---|---|
| FTEs | ||
| Direct impact | 46,385 | 47,404 |
| Indirect impact | 33,812 | 34,742 |
| Induced impact | 22,398 | 22,702 |
|
Note: The R&D pharmaceutical sector's total jobs were 104,848 FTEs in 2018 and 102,595 FTEs in 2019. Source: Statistics Canada, custom tabulation, Industry Accounts Division, reference years 2018 - 2019. |
||
Despite the decrease in personnel, the sector’s impact on labour income increased slightly, from $8.3 billion in 2018 to $8.5 billion in 2019. The increase in the sector’s direct impact ($149 million) was mostly responsible for this gain; however, the sector’s indirect impacts ($39 million) and induced impacts ($55 million) also contributed to the overall rise in labour income.

Description of figure 3
| 2019 | 2018 | |
|---|---|---|
| millions of dollars | ||
| Direct impact | 4,406 | 4,257 |
| Indirect impact | 2,608 | 2,569 |
| Induced impact | 1,520 | 1,465 |
|
Note: The R&D pharmaceutical sector's total labour income was $8,291 million in 2018 and $8,534 million in 2019. Source: Statistics Canada, custom tabulation, Industry Accounts Division, reference years 2018 - 2019. |
||
2.1.3 Trade
Imports in the sector exceeded $22 billion
The R&D pharmaceutical sector relies heavily on international trade, importing $20.6 billion of goods in 2018. In 2019, imports by the sector increased to $22.3 billion.Note As in 2018 ($7.5 billion), the single largest country of origin was the United States, which held fairly steady at $7.8 billion in 2019. Imports from Germany grew 20.6% from 2018 to reach $2.8 billion, the largest increase among the top five countries of origin in 2019.

Description of figure 4
| millions of dollars | |
|---|---|
| Africa | 6 |
| Americas (excluding USA) | 854 |
| Asia and Oceania | 935 |
| Europe | 12,698 |
| United States | 7,761 |
|
Note: The value of the R&D pharmaceutical sector's total goods imports in 2019 was $22,254 million. Source: Statistics Canada, custom tabulation, International Accounts and Trade Division, reference year 2019. |
|
On a trade region basis, imports of goods from the Americas (excluding the United States) grew the fastest compared to 2018, up 33.4% from $640 million to $854 million in 2019. Imports from Europe grew the most in absolute terms, going from $11.5 billion in 2018 to $12.7 billion in 2019.
In 2019, 60.8% of importers in the sector brought in goods from multiple countries, compared with 88.7% in 2018. This is largely due to a 41.1% increase in the number of companies that imported goods, up from 168 in 2018 to 237 in 2019. Most of the businesses who did not import in 2018 traded with only one partner country, indicating a narrower range of integration into the global trading system.
Most exports sent to the United States
The R&D pharmaceutical sector exported just over $5.9 billion in goods in 2019, a 17.2% increase from 2018. The vast majority of exports were destined for the United States ($5.1 billion), followed by Europe ($413 million) and Asia and Oceania ($274 million).

Description of figure 5
| millions of dollars | |
|---|---|
| Africa | 25 |
| Americas (excluding USA) | 113 |
| Asia and Oceania | 274 |
| Europe | 413 |
| United States | 5,076 |
|
Note: The value of the R&D pharmaceutical sector's total goods exports in 2019 was $5,901 million. Source: Statistics Canada, custom tabulation, International Accounts and Trade Division, reference year 2019. |
|
Almost all of the growth in total goods exports is attributable to exports to the United States, which increased $860 million, along with a small increase ($26 million) in exports to Europe. Exports to the rest of the world decreased $19 million, which partially offset the growth in exports to the United States and Europe.
The number of enterprises in the sector that exported goods tripled in 2019, but as with imports, most of these newly exporting businesses had a narrower range of integration into global trade, as most exporters who did not export in 2018 (84.3%) only exported to one partner country in 2019.
The sector had a total trade deficit (when imports exceed exports) of $16.4 billion in 2019, up $787 million from 2018. The largest deficit was with Europe ($11.2 billion in 2018 and $12.3 billion in 2019). Trade deficits also rose by $224 million with the Americas (excluding the USA) and by $56 million with Asia and Oceania. Deficits with the United States declined by $625 million and the trade surplus with African partners increased by $2 million.
2.2 Research and development
2.2.1 Total R&D expenditures
R&D activities of Canadian businesses and industrial non-profit organizations are compiled through the Annual Survey of Research and Development in Canadian Industry (RDCI). For this survey, companies are asked to report their R&D expenditures under two categories: in-house and outsourced. In-house R&D is performed by the business. In contrast, outsourced R&D refers to R&D performed by other businesses, organizations (e.g., universities), or individuals, either within or outside of Canada. Outsourced R&D can take the form of grants, fellowships, or contracts.
In general, Statistics Canada reports in-house and outsourced R&D separately, since adding in-house and outsourced expenditures together can potentially lead to double-counting of domestically outsourced R&D, as one company may report funding it, while another company reports performing it. Total R&D expenditures by the R&D pharmaceutical sector for 2019 were estimated to be between $1.6Note and $2.2Note billion.
2.2.2 In-house R&D expenditures
In-house R&D spending by the sector increased by more than $75 million to reach over $1.1 billion
In-house R&D expenditures by the Canadian R&D pharmaceutical sector totaled $1.1 billion in 2019, which accounted for 5.1% of all business enterprise expenditures on research and development (BERD) in Canada.Note The vast majority (91.1%) of these expenditures were spent on R&D in the medical and health sciences field. Almost 80% of all in-house R&D work was conducted in Quebec or Ontario, with the two provinces accounting for $448 million and $437 million, respectively.
Due to the R&D pharmaceutical sector’s knowledge-intensive nature, virtually all in-house R&D expenditures were current expenditures ($1.1 billion) as opposed to capital expenditures. This includes expenditures on wages (60.9%), materials (12.0%), and services used to support R&D activities (6.4%), as well as other current R&D costsNote (20.7%).
Capital R&D expenditures (e.g., software, land, buildings, equipment) amounted to $37 million in 2019, a 19.4% increase over 2018 numbers.Note
Sector added 770 FTEs of new R&D personnel in 2019
In 2019, the R&D pharmaceutical sector supported a total of 6,906 FTE R&D personnel. This included 3,157 FTE researchers, as well as 3,416 FTE technical support staff. Both of these occupational categories saw growth from 2018, increasing by 12.0% and 22.6%, respectively. The sector also employed 333 FTE consultants and contractors to perform on-site R&D. While the sector saw growth in research and support staff, on-site contractors decreased 196 FTEs, a decline of 37.1%.
2.2.3 Outsourced R&D expenditures
Outsourcing by the sector reached $1.1 billion in 2019, up almost $190 million from 2018
In addition to conducting in-house R&D, the R&D pharmaceutical sector also funded $1.1 billion of outsourced R&D expenses through grants, contracts, and other funding. Over half ($617 million) of this outsourced R&D spending stayed in Canada, while the remaining $519 million was outsourced internationally. Nearly three-fifths ($347 million) of all domestic outsourced R&D spending by businesses went to other businesses.
2.2.4 SR&ED eligible R&D expenditures
Nearly $1 billion in eligible R&D work claimed through the SR&ED program in 2019
Qualifying businesses in Canada are eligible to seek refundable tax credits for their R&D expenditures from the Government of Canada through the Scientific Research and Experimental Development (SR&ED) program. This tax incentive program promotes R&D among businesses regardless of their size or sector. Certain expenses, such as capital expenditures and R&D projects that are outsourced outside of Canada, cannot be claimed under the program.
Businesses in the R&D pharmaceutical sector had $969 million of approved SR&ED expenditures in 2019, of which $551 million was performed in-house and $417 million was outsourced to other organizations in Canada. For contextual purposes, businesses claimed just under half of their in-house R&D expenditures under the SR&ED Program, and around two-thirds of the costs of their outsourced R&D within Canada.

Description of figure 6
| 2019 | 2018 | |||
|---|---|---|---|---|
| Current In-House R&D | Outsourced In Canada R&D | Current In-House R&D | Outsourced In Canada R&D | |
| millions of dollars | ||||
| Claimed through SR&ED | 551 | 417 | 535 | 374 |
| Unclaimed | 519 | 200 | 466 | 72 |
|
Note: The R&D pharmaceutical sector's total current in-house R&D was $1,001 million in 2018 and $1,070 million in 2019. The sector's total outsourced in Canada R&D was $446 million in 2018 and $617 million in 2019. Source: Statistics Canada, custom tabulation, Scientific Research and Experimental Development Expenditures Claim, Survey of Research and Development in Canadian Industry, reference years 2018 - 2019. |
||||
Companies with revenue of at least $100 million claimed nearly three-quarters of in-house and outsourced spending through SR&ED.
Although Canadian companies accounted for almost 70% of both in-house and outsourced R&D expense claims under the SR&ED program, they accounted for only a small share of the total amount claimed. As a group, foreign-controlled companies, who tend to be larger performers of R&D overall, accounted for 78.2% of all in-house R&D expenses and 84.2% of all outsourced R&D expenses.
3. Innovative Medicines Canada members
3.1 Economic footprint
3.1.1 Value added
A majority of the R&D pharmaceutical sector’s economic impact was generated by members of the IMC
Innovative Medicines Canada (IMC) currently represents 48 R&D pharmaceutical companies in Canada. Its members include large established businesses as well as emerging start-ups.
IMC’s members generated $8.1 billion in GVA in 2019, accounting for 53.9% of the sector’s total GVA. This represents a 4.0% increase from the members’ GVA in 2018. IMC members’ direct impact on production contributed the largest share of the increase ($120 million) over its 2018 level, although there were also increases in the sector’s indirect ($92 million) and induced economic activities ($103 million).

Description of figure 7
| 2019 | 2018 | |
|---|---|---|
| millions of dollars | ||
| Direct impact | 4,118 | 3,998 |
| Indirect impact | 2,302 | 2,210 |
| Induced impact | 1,686 | 1,583 |
|
Note: IMC Members' total GVA was $7,791 million in 2018 and $8,106 million in 2019. Source: Statistics Canada, custom tabulation, Industry Accounts Division, reference years 2018 - 2019. |
||
3.1.2 Employment
Members see increases in labour income and jobs
There were approximately 55,400 jobs supported by IMC members in 2019, an increase of around 766 FTEs from 2018. IMC members directly employed around 24,900 FTEs, or 53.6% of the sector’s total direct FTEs, up from 51.4% in 2018. Jobs supported directly by the members contributed nearly two-thirds of the total increase (488 FTEs), with induced jobs accounting for virtually all of the remaining increase (266 FTEs).

Description of figure 8
| 2019 | 2018 | |
|---|---|---|
| FTEs | ||
| Direct impact | 24,876 | 24,388 |
| Indirect impact | 18,603 | 18,592 |
| Induced impact | 11,960 | 11,694 |
|
Note: IMC Members' total jobs were 54,674 FTEs in 2018 and 55,439 FTEs in 2019. Source: Statistics Canada, custom tabulation, Industry Accounts Division, reference years 2018 - 2019. |
||
Total labour income attributable to IMC members increased by 6.6%, or $280 million, in 2019. Of this increase, $160 million was tied to members’ direct impacts on labour income, although indirect production activities ($64 million) and members’ induced impacts ($56 million) also contributed significantly.

Description of figure 9
| 2019 | 2018 | |
|---|---|---|
| millions of dollars | ||
| Direct impact | 2,305 | 2,145 |
| Indirect impact | 1,429 | 1,365 |
| Induced impact | 806 | 750 |
|
Note: IMC Members' total labour income was $4,260 million in 2018 and $4,540 million in 2019. Source: Statistics Canada, custom tabulation, Industry Accounts Division, reference years 2018 - 2019. |
||
3.1.3 Trade
Imports increased while exports decreased
In 2019, IMC members imported $14.6 billion worth of goods, up $1.4 billion from the previous year. Two-thirds ($9.8 billion) of these imports came from Europe, with over half of European imports coming from three countries – Germany ($2.3 billion), Switzerland ($1.9 billion) and Belgium ($1.5 billion). IMC members imported $3.7 billion of goods from the United States, the largest single country of origin. Over four-fifths ($12.0 billion) of all imports were pharmaceutical products. The second-largest category was organic chemicals ($1.9 billion).
IMC members exported almost $1.3 billion worth of goods in 2019, down $426 million from 2018. Exports to the United States fell by $370 million from 2018 to reach $808 million, accounting for nearly 87.1% of the total decrease. Almost all (94.3%) of the goods that IMC members exported were pharmaceutical products.
3.2 Research and development
3.2.1 Total R&D expenditures
As previously noted, Statistics Canada generally reports in-house and outsourced R&D as separate values, since there exists a potential for double-counting outsourced R&D performed in Canada (as in-house R&D) when adding the two values together. Taking this limitation into account, IMC members performed between $0.9 and $1.4 billion in total R&D in 2019.
3.2.2 In-house R&D expenditures
IMC members have a higher R&D intensity than the sector overall
R&D is a discretionary activity undertaken with the intention of enhancing long-term success. A key measure of R&D within a sector is R&D intensity, defined as the amount a firm spends on its R&D divided by its revenue.Note In 2019, the R&D pharmaceutical sector had an intensity of 3.6%, which is an increase from 2018 when the sector had a R&D intensity of 3.3%. In comparison to the sector, the R&D intensity for IMC members was 3.9%, an increase of 0.5 percentage points from the previous year.
Intensity measures for both years were higher for members than the overall sector, and the gap between members’ intensity and the sector’s (0.4 percentage points) was wider in 2019 compared to 2018 (0.1 percentage points).

Description of figure 10
IMC Members had an R&D intensity of 3.4% in 2018 and 3.9% in 2019.
R&D Pharmaceutical Sector had an R&D intensity of 3.3% in 2018 and 3.6% in 2019.
Note: The R&D pharmaceutical sector is composed of both IMC members and a peer group of similar companies.
Source: Statistics Canada, custom tabulation, Survey of Research and Development in Canadian Industry, reference years 2018 - 2019.
In-house R&D up $100 million in 2019
In 2019, IMC members spent $723 million on in-house R&D projects, marking a 16.1% year-over-year increase from the $623 million spent in 2018. Most of the spending was in Ontario ($359 million) and Quebec ($287 million).
Virtually all of the 2019 spending was on current ($710 million) rather than capital ($13 million) expenditures. Wages and salaries saw the largest growth among the types of in-house expenditures, increasing $114 million dollars in 2019. These increases were offset by lower other current costs, which saw a net decrease of $13 million.
IMC members focused more on research than development
International statistical standards distinguish between the work of research and the work of development.Note The purpose of research is either to acquire knowledge (basic research) or to conduct investigations directed toward a specific practical goal (applied research). Development involves work directed towards the improvement of products or processes already in existence. IMC members tend to focus much more on research, as opposed to development, especially when contrasted with the companies that make up the rest of the sector. More precisely, research made up 67.1% of all R&D that IMC members performed in 2019, while research comprised only 35.4% of R&D performed by non-IMC companies of the R&D pharmaceutical sector.
Rising R&D technical and support jobs drive R&D personnel increase of 1,000 FTEs
The in-house R&D activities of IMC members were carried out by 4,350 FTE personnel, up around 1,000 FTEs from 2018. Most of these increases came from members engaging more technicians (+542 FTEs) and other R&D support personnel (+214 FTEs). Members’ R&D workers were primarily located in Ontario (44.7%) and Quebec (43.7%).
3.2.3 Outsourced R&D expenditures
Outsourced R&D spending increased $183 million in 2019
In addition to their in-house R&D expenditures, IMC members outsourced $721 million in R&D, an increase of 34.0% from $538 million in 2018. This accounted for 15.0% of outsourced spending by all Canadian businesses in 2019. Most of this growth occurred in expenditures for R&D outsourced within Canada, which rose $156 million to reach $507 million in 2019. R&D activities outsourced outside of Canada totalled $214 million in 2019, up $26 million from the year before. Overall, IMC members accounted for 63.5% of total outsourced R&D and 41.2% of internationally outsourced R&D in the sector.

Description of figure 11
| IMC Members | Rest of the sector | |
|---|---|---|
| millions of dollars | ||
| Canadian businesses | 271 | 76 |
| Canadian hospitals and universities | 140 | 16 |
| All other Canadian recipients | 97 | 17 |
| Foreign recipients | 214 | 305 |
| Source: Statistics Canada, custom tabulation, Survey of Research and Development in Canadian Industry, reference year 2019. | ||
Over a quarter of all R&D outsourced to Canadian hospitals and universities came from IMC members
IMC members increased their outsourcing of R&D to Canadian recipients in 2019 compared to 2018 and were responsible for 82.2% of the R&D pharmaceutical sector’s outsourcing within Canada. Specifically, IMC members spent $271 million on R&D that was performed by other Canadian businesses, $140 million by hospitals and universities, and $97 million for R&D performed by all other Canadian recipientsNote (which represented 78.1%, 89.7% and 85.1% of the total R&D outsourced by the R&D pharmaceutical sector, respectively).
IMC members also undertook important partnerships with Canadian hospitals and universities in 2019. Their partnerships accounted for 26.1% of the $537 million that was outsourced to Canadian hospitals and universities by companies across the entire Canadian economy in 2019.Note
3.2.4 SR&ED eligible R&D expenditures

Description of figure 12
| 2019 | 2018 | |||
|---|---|---|---|---|
| Current In-House R&D | Outsourced In Canada R&D | Current In-House R&D | Outsourced In Canada R&D | |
| millions of dollars | ||||
| Claimed through SR&ED | 396 | 342 | 360 | 304 |
| Unclaimed | 314 | 165 | 249 | 47 |
|
Note: IMC Members' total current in-house R&D was $609 million in 2018 and $710 million in 2019. Members' total outsourced in Canada R&D was $351 million in 2018 and $507 million in 2019. Source: Statistics Canada, custom tabulation, Scientific Research and Experimental Development Expenditures Claim, Survey of Research and Development in Canadian Industry, reference years 2018 - 2019. |
||||
IMC members had $396 million of in-house R&D expenditures, along with $342 million of outsourced R&D within Canada approved through the Government of Canada’s SR&ED tax program. Both total in-house and outsourced R&D expenses rose faster than the amounts approved through SR&ED, which resulted in a decline in the percent of total eligible expenses claimed for in-house (from 59.1% in 2018 to 55.8% in 2019) and outsourced R&D (from 86.6% in 2018 to 67.5% in 2019). Almost all IMC members who conducted R&D in 2019 filed claims for some or all of their in-house and outsourced R&D expenses.
4. Limitations
This study examines the economic impact of the R&D pharmaceutical sector within Canada in 2019, using a variety of data, including value added, employment, R&D activities, financial statistics, and international trade. While comprehensive, the study was not able to include in-depth employment characteristics related to the sector’s workforce, such as gender, age, immigration status, or education. This could be the focus of a future study.
A historical perspective would provide additional insight into a sector that has grown in prominence in Canadian society, and of growing interest to Canadians, given the rise of the novel coronavirus, which was first detected in Canada in early 2020. In the case of a lack of historical information for some businesses, estimation may be necessary.
It should be noted that the sectorial name, the "research and development pharmaceutical sector", used throughout this report to describe the cohort of companies examined in this study, is not an official name in the North American Industry Classification System (NAICS). The name was chosen based on the companies’ reported R&D activities and their placement within the pharmaceutical-related NAICS identified in this study. It should be further noted that although the name reflects the principal activities of the companies selected, some non-pharmaceutical activity of these companies is inevitably included, whereas the pharmaceutical activity of non-included firms will be missed.
While the data in this study is deemed to be of high quality, the success of any future studies depends upon the continued active participation of companies in the sector in surveys administered by Statistics Canada and the careful identification and tracking of R&D activity by such firms in the Canadian economy.
5. Appendix
5.1 Glossary
The Annual Survey of Research and Development in Canadian Industry (RDCI) is an annual survey that collects R&D expenditures and personnel data used to monitor science and technology related activities of business and industrial non-profit organizations in Canada.
Applied research is original investigation undertaken in order to acquire new knowledge. It is, however, directed primarily towards a specific, practical aim or objective. See also basic research; experimental development.
Basic price is the amount a producer receives from a purchaser for a unit of a good or service produced as output minus any tax payable and plus any subsidy receivable as a result of its production or sale.
Basic research is experimental or theoretical work undertaken primarily to acquire new knowledge of the underlying foundations of phenomena and observable facts, without any particular application or use in view. See also applied research; experimental development.
Business Enterprise Research and Development (BERD) is all research and development performed in Canada by the business enterprise sector, as measured by the Annual Survey of Research and Development in Canadian Industry performed by Statistics Canada.
Capital R&D expenditures are the annual gross amount paid for the acquisition of fixed assets that are used repeatedly or continuously in the performance of R&D for more than one year. They should be reported in full for the period when they took place, whether acquired or developed in house, and should not be registered as an element of depreciation.
Country of control is the country of residence of the ultimate controlling parent corporation, family, trust, estate or related group. Each subsidiary within the global enterprise is assigned the same country of control as its parent. Country of control data are derived from ownership questionnaires filed annually with Statistics Canada by corporations subject to the Corporations Returns Act, and from information obtained from the Canada Revenue Agency’s administrative records.
Current R&D expenditures are composed of labour costs and other current costs (including for external R&D personnel) used in R&D. Services and items (including equipment) used and consumed within one year are current expenditures. Annual fees or rents for the use of fixed assets should be included in current expenditures, as should overhead costs associated with R&D. See also other current costs.
Direct impacts are the effects directly attributed to an industry’s production. See also indirect impact; induced impact.
An economic footprint study aims to measure the total economic impact (direct, indirect, or induced) of an organization, sector or industry on a specific country or region during a given period. Economic impacts typically considered include gross value added and employment data. See also direct impact; indirect impact; induced impact.
Employees are all persons who work in or for the reporting unit, who have a contract of employment with the unit and who receive compensation in cash or in kind at regular intervals of time.
Experimental development is systematic work, drawing on knowledge gained from research and practical experience and producing additional knowledge, which is directed to producing new products or processes or to improving existing products or processes. See also applied research; basic research.
Exports are goods produced or manufactured in Canada that are subtracted from the stock of material resources in Canada, as a result of their movement out of the country.
A foreign-controlled company is any company whose country of control is not Canada, see country of control.
Full-time equivalent (FTE) is the total hours worked divided by average annual hours worked in full-time jobs.
Full-time equivalent (FTE) R&D personnel is defined as the ratio of working hours actually spent on R&D during a specific reference period (usually a calendar year) divided by the total number of hours conventionally worked in the same period by an individual or by a group.
Gross Domestic Product (GDP) is the total unduplicated value of the goods and services produced in the economic territory of a country or region during a given period. See also value added.
Gross value added is a measure of the contribution that a producer, industry or sector makes to GDP, it is defined as the value of output less the value of intermediate consumption. See also gross domestic product (GDP) and intermediate consumption.
Imports are goods that have entered the country by crossing territorial (customs) boundaries, whether for immediate domestic consumption or for storage in customs warehouses. Re-imports are included in Canadian trade data. These are goods, materials or articles that are imported in either the same condition in which they were exported or after undergoing repair or minor alterations (e.g., blending, packaging, bottling, cleaning or sorting) that leave them essentially unchanged. Domestic re-imports are goods of Canadian origin, whether grown, extracted, or manufactured in Canada that are exported to another country and then returned to Canada in ‘the same state’ as they were sent out. See also exports.
Indirect impacts are upstream economic activities associated with supplying intermediate inputs (the current expenditures on goods and services used up in the production process) to the directly impacted industries. See also direct impact; induced impact.
Induced impacts are additional economic activities derived from the labour income generated by both the direct and indirect effects when spent in the market place. See also direct impact; indirect impact.
An industry is a group of establishments engaged in the same, or similar, kinds of economic activity. See also North American Industry Classification System (NAICS); sector.
In-house R&D is expenditures within Canada for R&D performed within this business by employees or self-employed individuals or contractors who are working on site on a business’s R&D projects.
Intermediate consumption is the products used by an industry to produce outputs. These products may come from domestic production or from imports. See gross value added.
Labour income consists of the sum of wages and salaries and employer’s social contributions of employees and the labour income of the self-employed.
North American Industry Classification System (NAICS) is a business-classification system developed through a partnership among the United States, Mexico and Canada. Companies are classified by their same or similar production processes. NAICS Canada 2017 Version 3.0 divides the Canadian economy into 20 sectors, 102 subsectors, 324 industry groups, 710 industries and 928 Canadian industries. See also sector; industry.
Other current costs are non-capital purchases of materials, supplies, equipment and services to support R&D performed by the reporting unit in the reference year. Examples are water and fuel (including gas and electricity); books, journals, reference materials, subscriptions to libraries, scientific societies, etc.; imputed or actual costs of small prototypes or models made outside the reporting unit; and materials for laboratories (e.g., chemicals, animals, etc.). Other current costs include royalties or licences for the use of patents and other intellectual property rights, the lease of capital goods (machinery and equipment, etc.) and the rental of buildings to support R&D performed by the reporting unit in the reference year. Overhead costs associated with R&D are also included in other current costs. See also current R&D expenditures.
Output consists primarily of the value of goods and services produced by an industry.
Outsourced R&D are payments made within or outside Canada to other businesses, organizations or individuals to fund R&D performance through grants, fellowships, or contracts.
R&D personnel are all persons engaged directly in R&D, whether employed by the reporting unit or external contributors fully integrated into the reporting unit’s R&D activities, as well as those providing direct services for the R&D activities (such as R&D managers, administrators, technicians and clerical staff).
The reporting unit is the unit from which data are reported. This corresponds to the unit that would receive a questionnaire or interview. In the case of administrative data, it would correspond to the unit that is represented by the individual record.
Research and development (R&D) is creative and systematic work undertaken in order to increase the stock of knowledge – including knowledge of humankind, culture and society – and to devise new applications of available knowledge. See also applied research; basic research; experimental development.
Researchers are professionals engaged in the conception or creation of new knowledge. They conduct research and improve or develop concepts, theories, models, techniques instrumentation, software or operational methods.
The Scientific Research and Experimental Development (SR&ED) Tax Incentive Program is intended to encourage Canadian businesses of all sizes and in all sectors to conduct R&D in Canada. These tax incentives come in three forms: an income tax deduction, an investment tax credit (ITC), and, in certain circumstances, a refund. Corporations, individuals, trusts and members of a partnership can use these Government of Canada incentives.
A sector is a high level section of the economy encompassing economic activity in several related industry groups. See also industry; North American Industry Classification System (NAICS).
5.2 Populations
Innovative Medicines Canada (IMC) provided two cohort lists to Statistics Canada. The first was a list of its members. The second was a list of peer companies, comprising those in the pharmaceutical space that were actively involved in developing new medicines and treatments. It excluded generic pharmaceutical manufacturers, wholesalers without R&D in Canada, pure medical device manufacturers and businesses primarily involved in veterinary medicines. Statistics Canada supplemented the peer list with companies whose R&D was primarily focused on human medicine and health sciences. Data in the report comprised estimates for the R&D pharmaceutical sector (both IMC members and the peer group) and IMC members only.
5.3 Business structures
For collection purposes, Statistics Canada distinguishes between four different business levels, all of which are present in all businesses in Canada. These levels, from highest to lowest, are enterprise, company, establishment, and location. For simple businesses, particularly those where all business activities are based in one location, there are no practical differences between the four levels. Statistics Canada recognizes that complex businesses, which may haves a head office and separate locations for regional offices, R&D, manufacturing, sales, etc., produce and record different types of information at different levels within the business. Therefore, different levels of entities are surveyed depending on the nature of the data being sought.
This study pulled data from several different Statistics Canada business surveys, which surveyed companies at different business levels. The cohort lists provided to Statistics Canada were at the company level. Statistics Canada linked entities at the company level to those at the establishment or enterprise levels, depending on the suitable conceptual level for the data.
Data on gross value added and employment, and all associated impacts – direct, indirect and induced – were processed at the establishment level, the lowest level at which accounting data required to measure production is available.
Tax data are processed by the Canada Revenue Agency at the business number level, which generally corresponds to the company level. Since many companies that perform R&D report Scientific Research and Experimental Development (SR&ED) tax credit claims, R&D data are collected at the same level as tax data to reduce response burden by enabling reporting units to use the same accounting level for reporting R&D.
Trade and financial data are collected at the enterprise level, the highest level within the business structure. This is the level at which businesses keep these types of records.
Where a complex enterprise has a company which is part of the R&D pharmaceutical sector and another company which is not, both companies are included by virtue of the business organizations reporting structure.
5.4 Methods
Where microdata were provided, analysts undertook a data review to confirm the suitability of the data for use in this report. As a result, one enterprise record was modified to include only business activities in Canada.
The R&D data were comprised primarily of actual respondent data. Where companies did not respond to the reference year (RY) 2019 RDCI survey, data were imputed using historical values and SR&ED tax data. For more information on data sources, accuracy, and methodology of the RDCI survey please refer to the Integrated Metadatabase, the metadata repository for Statistics Canada products.
5.4.1 Economic impacts
The direct economic impacts of the Canadian R&D pharmaceutical sector were measured on the basis of the industry’s outputs and gross value added. Outputs include the measurement of goods and services produced by an establishment. Gross value added measures the value of output less the value of intermediate consumption, which consists of all goods and services used up in the course of production within an accounting period.
The calculation of the economic impacts were derived using the 2018 and 2019 tax data associated with the companies and enterprises identified as members of Innovative Medicines Canada, as well as the overall sector. This information was entered into the Statistics Canada National Input-Output Model (Statistics Canada service 36-23-0002) which provided estimates for the other direct impact metrics such as labour income, jobs and FTEs, as well as the indirect and induced economic impact for all variables.
The Statistics Canada National Input-Output Model is derived from the Supply and Use Tables (Statistics Canada catalogue 15-602-X). The model is updated every year to coincide with the most recent version of the Supply and Use Tables. The Input-Output model used in the economic impact study is based on the 2018 version of the Supply and Use tables.
The impact estimates provided by the model for output, gross value added and labour income are derived from information included in the Supply and Use Tables. The impact estimates provided by the model for jobs and FTEs are derived from the labour productivity and related measures by business sector industry and by non-commercial activity consistent with the industry accounts (Statistics Canada table 36-10-0480-01).
- Date modified: