
Analysis in Brief
The Retail Cannabis Market in Canada: A Portrait of the First Year

Archived Content
Information identified as archived is provided for reference, research or recordkeeping purposes. It is not subject to the Government of Canada Web Standards and has not been altered or updated since it was archived. Please "contact us" to request a format other than those available.
Correction Notice
Corrections have been made to this product.
Please take note of the following changes:
December 12, 2019
A correction was made on December 12, 2019 to reflect that online cannabis distribution in Alberta is conducted under the public retail model and not the private model as originally indicated.
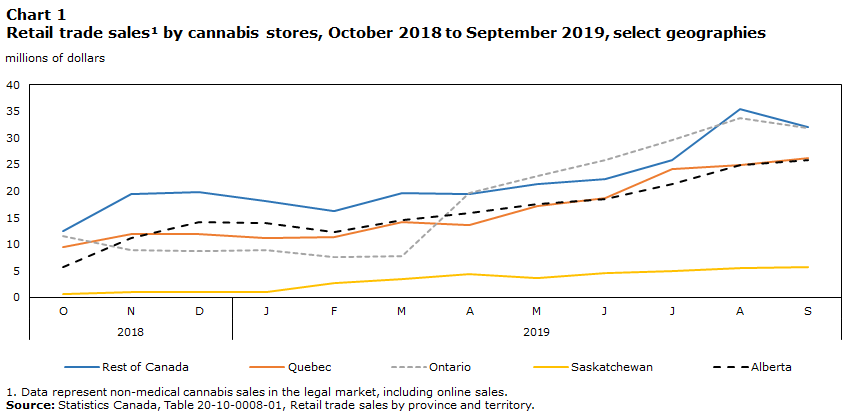
In the year following the legalization of non-medical cannabis in Canada, the retail non-medical cannabis market has grown considerably, with retailers of legal cannabis establishing more than 400 brick-and-mortar stores and registering $908 million in online and retail store sales (Chart 1).
Data table for Chart 1
| 2018 | 2019 | |||||||||||
|---|---|---|---|---|---|---|---|---|---|---|---|---|
| O | N | D | J | F | M | A | M | J | J | A | S | |
| millions of dollars | ||||||||||||
| Rest of Canada | 12,431,891 | 19,411,306 | 19,900,134 | 18,132,182 | 16,322,820 | 19,590,280 | 19,362,630 | 21,357,472 | 22,238,528 | 25,928,348 | 35,516,427 | 32,070,884 |
| Quebec | 9,415,586 | 11,859,076 | 11,992,781 | 11,217,753 | 11,389,083 | 14,107,288 | 13,598,216 | 17,129,629 | 18,764,537 | 24,195,624 | 24,981,593 | 26,211,588 |
| Ontario | 11,453,939 | 8,919,722 | 8,720,707 | 8,947,005 | 7,539,152 | 7,691,964 | 19,687,110 | 22,820,558 | 25,855,485 | 29,613,021 | 33,771,918 | 31,786,026 |
| Saskatchewan | 579,752 | 926,321 | 969,660 | 960,330 | 2,700,247 | 3,477,914 | 4,371,738 | 3,606,460 | 4,531,186 | 4,989,680 | 5,442,745 | 5,609,290 |
| Alberta | 5,700,750 | 11,205,413 | 14,225,138 | 14,037,065 | 12,341,781 | 14,482,623 | 15,876,414 | 17,470,051 | 18,422,591 | 21,340,218 | 24,861,633 | 25,775,892 |
| Total | 39,581,918 | 52,321,838 | 55,808,420 | 53,294,335 | 50,293,083 | 59,350,069 | 72,896,108 | 82,384,170 | 89,812,327 | 106,066,891 | 124,574,316 | 121,453,680 |
|
||||||||||||
Since October 2018, the provinces and territories have instituted a variety of regulatory frameworks to manage the distribution and sale of non-medical cannabis Note in their jurisdictions, resulting in an industry structure composed of public, private, and hybrid systems engaging in retail trade through both brick-and-mortar and online stores.
As the industry establishes itself and the market develops, Canadians’ access to cannabis retailers is increasing. This paper describes recent trends in the retail cannabis sector,Note provides an update to Statistics Canada’s October 2018 proximity study,Note and highlights the role that accessibility, online sales and wholesaler retail sales have played in the evolution of the cannabis market to date.
Overview of provincial and territorial sales
Ontario cannabis retailers led sales at the provincial level, contributing $217 million to the sector from October 2018 to September 2019, followed by Alberta ($196 million) and Quebec ($195 million) (Table 1).
| Total retail sales at cannabis stores | July 1st Q3 2019 population estimate | Sales per capita | |
|---|---|---|---|
| unadjusted dollars (thousands) | persons | dollars | |
| CanadaTable 1 Note 2 | 907,833 | 37,589,262 | 24 |
| Newfoundland and Labrador | 30,615 | 521,542 | 59 |
| Prince Edward Island | 15,216 | 156,947 | 97 |
| Nova Scotia | 65,805 | 971,395 | 68 |
| New Brunswick | 37,905 | 776,827 | 49 |
| Quebec | 194,865 | 8,484,965 | 23 |
| Ontario | 216,807 | 14,566,547 | 15 |
| Manitoba | 56,103 | 1,369,465 | 41 |
| Saskatchewan | 38,165 | 1,174,462 | 32 |
| Alberta | 195,740 | 4,371,316 | 45 |
| British Columbia | 49,659 | 5,071,336 | 10 |
| Yukon | 4,216 | 40,854 | 103 |
| Northwest Territories | 2,737 | 44,826 | 61 |
| Nunavut | Note ...: not applicable | 38,780 | Note ...: not applicable |
... not applicable
|
|||
In contrast, British Columbia, one of the four most populous provinces, reported relatively low total sales at cannabis stores ($50 million) and the lowest sales per capita values in the country at $10 during the same period. Conversely the Yukon, one of the least populated regions in the country, reported the highest per capita sales at $103, with Prince Edward Island and Nova Scotia observing the next highest values at $97 and $68 average sales per person respectively.
Differences between regions in total and per capita cannabis store sales may be explained in part by Canadian’s access to cannabis stores. A variety of factors may influence access to cannabis in a given region including the administrative and operational steps required to establish a cannabis retail store (which may affect the pace at which new outlets are able to open for business), the immediate or staggered entry of retail operations over the course of the year, competition from illegal markets, the density and distribution of the population and of stores in a given region, demographic and income factors, disruptions in the supply chain, and differences in the regulatory approaches pursued by regional governments. Examples of regulatory influences include increasing the federally mandated minimum age; lowering possession limits; a jurisdiction’s decision to support a public, private, or hybridNote retail model; limitations on the number of private stores to be established; restrictions on store locations and proximity to schools and restrictions on hours of operation (Myran, Brown & Tanuseputro, 2019).
Cannabis regulation across Canada
With the enactment of the Cannabis Act, provinces and territories are responsible for determining how non-medical cannabis is distributed and sold in their jurisdictions. Each jurisdiction has chosen to operate either a government-run retail model, a privately run model, or a hybrid of the two. Table 2 describes the model choice of each regional government, and the physical or online retail distribution modes they employ.
| Retail model | Physical retail | Online retail | |
|---|---|---|---|
| Newfoundland and Labrador | Public | Note ...: not applicable | √ |
| Private | √ | Note ...: not applicable | |
| Prince Edward Island | Public | √ | √ |
| Private | Note ...: not applicable | Note ...: not applicable | |
| Nova Scotia | Public | √ | √ |
| Private | Note ...: not applicable | Note ...: not applicable | |
| New Brunswick | Public | √ | √ |
| Private | Note ...: not applicable | Note ...: not applicable | |
| Quebec | Public | √ | √ |
| Private | Note ...: not applicable | Note ...: not applicable | |
| Ontario | Public | Note ...: not applicable | √ |
| Private | √ | Note ...: not applicable | |
| Manitoba | Public | Note ...: not applicable | Note ...: not applicable |
| Private | √ | √ | |
| Saskatchewan | Public | Note ...: not applicable | Note ...: not applicable |
| Private | √ | √ | |
| Alberta | Public | Note ...: not applicable | √ |
| Private | √ | Note ...: not applicable | |
| British Columbia | Public | √ | √ |
| Private | √ | Note ...: not applicable | |
| Yukon | Public | √ | √ |
| Private | √ | Note ...: not applicable | |
| Northwest Territories | Public | √ | √ |
| Private | Note ...: not applicable | Note ...: not applicable | |
| Nunavut | Public | Note ...: not applicable | Note ...: not applicable |
| Private | Note ...: not applicable | Note ...: not applicable | |
|
... not applicable Source: Statistics Canada |
|||
Cannabis is available through online retail in every province and territory, with only Manitoba and Saskatchewan allowing online sales via the private retail model. The majority of private and hybrid retail models are in Western Canada. Nunavut is the only jurisdiction without a physical retail store.
A growing number of cannabis stores
The seven regions operating under private and hybrid retail models are home to 72% of the Canadian population and 85% of retail cannabis stores (Table 3). Since the legalization of non-medical cannabis, these private and hybrid model stores account for 65% of sales to date (as of September 2019). The total number of cannabis retail stores in Canada rose from 217 in March 2019 to 407 in July 2019, an increase of 88%.Note Alberta held top rank in store count since legalization and opened the most stores (101) between March and July 2019 for a total of 176 cannabis stores province-wide. Starting with just 16 stores in March, the number of cannabis outlets in British Columbia increased to 57 in July, the second highest number of cannabis outlets in the country.
Prior to legalization Ontario shifted from its planned public retail model to a hybrid model, permitting a first wave of private brick-and-mortar stores to open in April 2019. Despite the lag in the introduction of private retail stores, and despite having fewer stores (Ontario ranked 5th in the country with 24 stores in July 2019), the province has since surpassed Alberta in total retail sales from cannabis stores.Note Notably, within the March-July 2019 time frame, there was little change in counts of publicly operated stores across the regions with the exception of Quebec, which added four more stores.
The proximity of Canadian households to retail cannabis stores
One way to examine Canadians’ increasing access to cannabis products is to estimate the distance from households to retail cannabis stores. In this study, a measure of proximity was calculated by determining the location of each Canadian household in Statistics Canada’s geographic databases, and calculating the distance from its location to the nearest legal retail cannabis outlet.Note Population-weighted averagesNote of these distances were then derived to determine how generally accessible retail cannabis products are to Canadians. It should be noted this measure does not account for online distribution or illegal retail stores (online sales are discussed later in this paper).
| PopulationTable 3 Note 1 | Store countTable 3 Note 2 | Population weighted average distance | |||||
|---|---|---|---|---|---|---|---|
| 2019 | 2019 | ||||||
| March | May | July | March | May | July | ||
| people | number | kilometres | |||||
| Canada | 36,540,268 | 217 | 285 | 407 | 66 | 39 | 34 |
| Newfoundland and Labrador | 528,567 | 26 | 26 | 26 | 34 | 34 | 34 |
| Prince Edward Island | 150,566 | 4 | 4 | 4 | 12 | 12 | 12 |
| Nova Scotia | 950,680 | 13 | 13 | 13 | 20 | 20 | 20 |
| New Brunswick | 766,852 | 21 | 21 | 21 | 15 | 15 | 15 |
| Quebec | 8,297,717 | 14 | 16 | 18 | 47 | 37 | 35 |
| Ontario | 14,071,445 | Note ...: not applicable | 20 | 24 | Note ...: not applicable | 44 | 43 |
| Manitoba | 1,335,396 | 21 | 23 | 23 | 28 | 28 | 28 |
| Saskatchewan | 1,150,782 | 19 | 26 | 35 | 50 | 47 | 37 |
| Alberta | 4,243,995 | 75 | 101 | 176 | 25 | 22 | 13 |
| British Columbia | 4,922,152 | 16 | 27 | 57 | 57 | 46 | 24 |
| Yukon | 39,628 | 2 | 2 | 4 | 104 | 104 | 103 |
| Northwest Territories | 44,936 | 6 | 6 | 6 | 100 | 100 | 100 |
| NunavutTable 3 Note 3 | 37,552 | Note ...: not applicable | Note ...: not applicable | Note ...: not applicable | Note ...: not applicable | Note ...: not applicable | Note ...: not applicable |
... not applicable
|
|||||||
The population-weighted average distance between Canadians and the nearest cannabis store was 34 km in July 2019, nearly half the distance observed in March (66 km). Residents of Prince Edward Island travelled the shortest average distance to access cannabis stores in all three time periods observed (12 km). In Alberta, which ranked second in accessibility, the measure of proximity changed from 25 km in March, to 13 km in July 2019 after the roll out of over 100 new stores. The most significant improvement in average distance to the nearest cannabis store was observed in British Columbia, where a decrease from 57 km to 24 km was observed after an additional 41 cannabis retail stores opened over that same period.
Table 4 shows the cumulative proportion of the population in each province and territory residing within a given distance of a cannabis retail store. As of July 2019, 45% of Canadians live within 10 km of a cannabis store, while 30% live within 5 km, and 19% live within 3 km.
| Given distance to a cannabis store | ||||
|---|---|---|---|---|
| 3 km | 5 km | 10 km | ||
| percent | ||||
| Canada | March 2019 | 12 | 20 | 31 |
| July 2019 | 19 | 30 | 45 | |
| Newfoundland and Labrador | March 2019 | 37 | 46 | 55 |
| July 2019 | 37 | 46 | 55 | |
| Prince Edward Island | March 2019 | 26 | 34 | 49 |
| July 2019 | 26 | 34 | 49 | |
| Nova Scotia | March 2019 | 26 | 38 | 48 |
| July 2019 | 26 | 38 | 48 | |
| New Brunswick | March 2019 | 23 | 36 | 51 |
| July 2019 | 23 | 36 | 51 | |
| Quebec | March 2019 | 12 | 24 | 43 |
| July 2019 | 13 | 27 | 48 | |
| Ontario | March 2019 | Note ...: not applicable | Note ...: not applicable | Note ...: not applicable |
| July 2019 | 9 | 18 | 33 | |
| Manitoba | March 2019 | 29 | 44 | 54 |
| July 2019 | 29 | 44 | 54 | |
| Saskatchewan | March 2019 | 26 | 38 | 44 |
| July 2019 | 32 | 41 | 48 | |
| Alberta | March 2019 | 35 | 48 | 61 |
| July 2019 | 50 | 63 | 70 | |
| British Columbia | March 2019 | 10 | 17 | 28 |
| July 2019 | 23 | 32 | 46 | |
| Yukon | March 2019 | 7 | 22 | 31 |
| July 2019 | 18 | 29 | 31 | |
| Northwest Territories | March 2019 | 32 | 46 | 52 |
| July 2019 | 44 | 58 | 62 | |
| Nunavut | March 2019 | Note ...: not applicable | Note ...: not applicable | Note ...: not applicable |
| July 2019 | Note ...: not applicable | Note ...: not applicable | Note ...: not applicable | |
|
... not applicable Source: Statistics Canada. |
||||
In Alberta 70% of the population lived within 10 km of a cannabis retail outlet in July 2019, up from 61% in March. The proportion of households within 3 km of a retail cannabis outlet increased from 35% in March to 50% in July after the opening of an additional 101 stores. Meanwhile, in neighboring British Columbia nearly a third of residents (28%) lived less than 10 km from a cannabis store as of March, with this figure increasing to nearly half (46%) the population by July 2019 after the store count grew from 16 to 57.
Only 33% of Ontarians lived within 10 km of a cannabis store in July 2019 due to the later roll-out of the province’s private retail outlets. Retail sales from cannabis stores in Canada’s most populous province accelerated significantly in April 2019 with the introduction of the first physical outlets. While Ontario ranks relatively low in the July proximity and accessibility measures compared to other provinces, these figures are expected to change given recent developments in provincial license allocations.
Online and wholesaler retail sales
Online sales of cannabis are an important vector of consumer access. Every province and territory, regardless of the existence of physical stores, provides access to non-medical cannabis through online stores. Most online sales are operated under the public retail model, the exception being Manitoba and Saskatchewan. Online sales were relatively stable over the observation period, however the share of online sales from cannabis stores steadily declined from 43.4% in October 2018 to 5.9% of sales in September 2019 due to the increase in the number of physical cannabis stores and their sales (Table 5). Online sales represented 13.3% of total sales from cannabis stores since legalization.
| Online retail sales of non-medical cannabis | Total retail sales of non-medical cannabis | Proportion of total retail sales | |
|---|---|---|---|
| unadjusted dollars (thousands) | percent | ||
| Total | 120,586 | 907,833 | 13.3 |
| September 2019 | 7,120 | 121,453 | 5.9 |
| August 2019 | 9,262 | 124,576 | 7.4 |
| July 2019 | 7,808 | 106,065 | 7.4 |
| June 2019 | 7,783 | 89,811 | 8.7 |
| May 2019 | 8,657 | 82,384 | 10.5 |
| April 2019 | 9,740 | 72,895 | 13.4 |
| March 2019 | 11,123 | 59,350 | 18.7 |
| February 2019 | 9,891 | 50,292 | 19.7 |
| January 2019 | 11,061 | 53,294 | 20.8 |
| December 2018 | 9,283 | 55,808 | 16.6 |
| November 2018 | 11,692 | 52,322 | 22.3 |
| October 2018 | 17,166 | 39,583 | 43.4 |
|
|||
In some retail models, wholesale distributors also sell to retail consumers and are therefore included in the assessment of the cannabis retail market.Note
Direct-to-consumer trade by wholesalers, including retail sales by publicly operated cannabis stores classified as wholesalers, accounted for a total 1.9% of cannabis-related retail activity since October 2018, reaching a high of 4.4% in November 2018 and averaging less than 1% in September 2019 (Table 6).
| Retailers’ sales of non-medical cannabis | Wholesalers’ retail sales of non-medical cannabis | Total retail activity | Wholesalers proportion of total retail activity | |
|---|---|---|---|---|
| unadjusted dollars (thousands) | percent | |||
| Total | 907,833 | 17,541 | 925,374 | 1.9 |
| September 2019 | 121,453 | 904 | 122,357 | 0.7 |
| August 2019 | 124,576 | 931 | 125,507 | 0.7 |
| July 2019 | 106,065 | 1,095 | 107,160 | 1.0 |
| June 2019 | 89,811 | 1,232 | 91,043 | 1.4 |
| May 2019 | 82,384 | 1,377 | 83,761 | 1.6 |
| April 2019 | 72,895 | 1,380 | 74,275 | 1.9 |
| March 2019 | 59,350 | 1,391 | 60,741 | 2.3 |
| February 2019 | 50,292 | 1,419 | 51,711 | 2.7 |
| January 2019 | 53,294 | 1,796 | 55,090 | 3.3 |
| December 2018 | 55,808 | 2,005 | 57,813 | 3.5 |
| November 2018 | 52,322 | 2,409 | 54,731 | 4.4 |
| October 2018 | 39,583 | 1,602 | 41,185 | 3.9 |
|
||||
Conclusion
Since the legalization of cannabis, online and retail store sales have reached $908 million. With more than 400 retail stores in the country, 45% of Canadians live within 10 km of a cannabis store. While online cannabis retail ensures access to all Canadians regardless of proximity to a physical store, accessibility continues to improve as more stores open across the country. Among the provinces and territories, a diverse array of retail models and regulatory frameworks have influenced the structure and pace of the emerging cannabis market. The cannabis retail market will continue to evolve as jurisdictions adapt their regulatory approaches, as supply chains develop and as cannabis product offerings diversify. Measures such as retail sales values and proximity estimates will continue to be important sources of market insight. Over time, as more data are collected, Statistics Canada will continue to serve the interest of Canadians by observing market trends and developing new indicators that help assess the growing cannabis industry.
Bibliography
Caulkins J. P., Kilborn M. L. (2019). Cannabis legalization, regulation, & control: a review of key challenges for local, state, and provincial officials. American Journal of Drug and Alcohol Abuse 28, 1-9. DOI: https://www.doi.org/10.1080/00952990.2019.1611840.
Crépault, J-F. (2014). Cannabis policy framework. Toronto: Centre for Addiction and Mental Health.
Deloitte (2018). A society in transition, an industry ready to bloom: 2018 cannabis report.
Goodman S., Leos-Toro C., Hammond D. (2019). Methods to assess cannabis consumption in population surveys: results of cognitive interviewing. Qualitative Health Research, 2019, 1-9. DOI: https://www.doi.org/10.1177/1049732318820523.
Health Canada (2018). Canadian Cannabis Survey 2018 Summary.
Henriksen L., Feighery E. C., Schleicher N.C., Cowling D. W., Kline R. S., Fortmann, S. P. (2008). Is adolescent smoking related to the density and proximity of tobacco outlets and retail cigarette advertising near schools? Preventative Medicine 47, 210–4. DOI: https://www.doi.org/10.1016/j.ypmed.2008.04.008 .
Macdonald R., Rotermann M. (2018). Constructing Historical Cannabis Consumption Volume Estimates for Canada: 1960 to 2015. Analytical studies: methods and references. Statistics Canada Catalogue no. 11-633-X.
Mawani F., Maslov A., Lawrence A. (2017). Measuring Illicit Cannabis Seizures in Canada: Methods, Practices and Recommendations. Research Report 2017-R002. Ottawa: Public Safety Canada.
Medical use of cannabis. (n.d.). Ottawa: Government of Canada.
Morrison C., Gruenewald P. J., Freisthler B., Ponicki W. R., Remer L. G. (2014). The economic geography of medical cannabis dispensaries in California. International Journal of Drug Policy 25(3), 508–15. DOI: https://www.doi.org/10.1016/j.drugpo.2013.12.009 .
Myran D. T., Brown, C. R. L., Tanuseputro, P. (2019). Access to cannabis retail stores across Canada 6 months following legalization: a descriptive study. Canadian Medical Association Journal, 7(3), E454-E461. DOI: https://www.doi.org/10.9778/cmajo.20190012 .
Rotermann, M. (2019). Analysis of trends in the prevalence of cannabis use and related metrics in Canada. Health reports 30(6). Statistics Canada Catalogue no. 82-003-X. DOI: https://www.doi.org/10.25318/82-003-x201900600001-eng.
Rotermann M., Pagé M. M. (2018). Prevalence and correlates of non-medical only compared to self-defined medical and non-medical cannabis use, Canada, 2015. Health Reports 29(7), 3-13.
Shi Y, Meseck K, Jankowska MM (2016) Availability of medical and recreational marijuana stores and neighborhood characteristics in Colorado. J Addict 2016:7193740. DOI: https://www.doi.org/10.1155/2016/7193740 .
Statistics Canada. (2017). A cannabis economic account – The framework. Latest Developments in the Canadian Economic Accounts. Statistics Canada Catalogue no. 13-605-X.
Statistics Canada. (2017). Preparing the statistical system for the legalization of cannabis. Latest Developments in the Canadian System of National Accounts. Statistics Canada Catalogue no. 13 605-X.
Statistics Canada. (2018). Access by Canadians to regulated liquor and cannabis retail outlets. Latest Developments in the Canadian System of National Accounts. Statistics Canada Catalogue no. 13 605-X.
Statistics Canada. (2018). Cannabis legalization: why proximity matters. StatCan Blog.
Statistics Canada. (2018). Cannabis Stats Hub. Statistics Canada Catalogue no. 13-610-X Retrieved November 22, 2019.
Statistics Canada. (2019). Incorporating the cannabis market in the national economic accounts, fourth quarter 2018. Latest Developments in the Canadian Economic Accounts. Statistics Canada Catalogue no. 13-605-X.
Statistics Canada. (2019). National Cannabis Survey, third quarter 2019. The Daily. Retrieved October 30, 2019.
Statistics Canada. (2019). Population estimates, quarterly. Table 17-10-0009-01. Retrieved November 22, 2019.
Statistics Canada. (2019). Retail trade sales by province and territory. Table 20-10-0008-01. Retrieved November 22, 2019.
Statistics Canada. (2019). Surveys and statistical programs: Business Register. Retrieved November 22, 2019.
Statistics Canada. (2019). Surveys and statistical programs: Census of Population. Retrieved November 22, 2019.
Statistics Canada. (2019). Surveys and statistical programs: National Cannabis Survey. Retrieved November 22, 2019.
Werb D., Nosyk B., Montaner J., Kerr T., Fischer B., Wood E. (2012). Estimating the economic value of British Columbia's domestic cannabis market: Implications for provincial cannabis policy. International Journal of Drug Policy 23, 436-441. DOI: https://www.doi.org/10.1016/j.drugpo.2012.05.003.
What you need to know about cannabis: Cannabis in Canada - get the facts. (n.d.). Ottawa: Government of Canada.
Notes
- Date modified: