
Analysis in Brief
Indicators of profit shifting by multinational enterprises operating in Canada

Archived Content
Information identified as archived is provided for reference, research or recordkeeping purposes. It is not subject to the Government of Canada Web Standards and has not been altered or updated since it was archived. Please "contact us" to request a format other than those available.
by Alexandre Fortier-Labonté and Claire Schaffter
Introduction
Globalization refers to the economic integration between countries as a result of increasing cross-border trade and capital movements.
Multinational enterprises (MNEs)Note have been drivers of globalization. These enterprises have taken advantage of innovations in logistics and communications technology over the past four decades to diversify their supply chains and expand into new markets. Operating internationally, however, also allows MNEs to take advantage of tax systems which were designed for a less integrated era. For example, MNEs can arrange for profits to be ‘shifted’ by charging affiliates in high tax locations prices above market rates in transactions with affiliates in lower tax regions. These behaviours are referred to as Base Erosion and Profit Shifting (BEPS), and although not illegal, they impact government revenues worldwide.
The Organization for Economic Cooperation and Development (OECD) estimates that worldwide taxation revenues lost due to BEPS account for a significant amount (OECD 2015). To coordinate reforms and eliminate opportunities for BEPS, the OECD has developed a multipart Action Plan which includes recommendations for countries to enhance their corporate tax systems and suggests ways to measure and monitor BEPS.
Due to data limitations and the challenge of identifying activities that are motivated by tax minimization, the impacts of BEPS on tax revenues for any one country are notoriously difficult to quantify. Using the various data sources at our disposal, in this paper we aim instead at looking for patterns that suggest that MNEs with operations in Canada are using BEPS strategies. While evidence of BEPS implies that these firms are reducing the amount of taxes they owe globally, our analysis stops short of quantifying how this impacts Canada's tax base.Note
To examine this issue, we follow the approach to measuring BEPS described in Action 11 of the OECD’s BEPS Action Plan, which recommends creating a ‘dashboard’ of simple indicators that provide different perspectives on BEPS. The OECDs intention is for these measures to be considered together to see whether they “point” in the same direction.
The remainder of this paper is divided into four sections. Section 1 looks for mismatches between financial and real economic activity using macroeconomic data from Statistics Canada and the World Bank.
Sections 2 and 3 both use firm-level data to recreate indicators of BEPS that were built by the OECD. Section 2 uses data on the activities of Canadian firms and their subsidiaries abroad to discover whether that profit rate differentials within MNEs are associated with the tax rates of the jurisdictions where affiliates operate.Note Section 3 compares tax rates for MNEs to those of firms that operate only in Canada.
Section 4 concludes and suggests directions for further research.
Section 1: Disconnect between financial and real economic activities
Discrepancies between financial and real economic activity within a country can be a sign that income is not reported, and therefore not taxed, where it was earned. The two indicators in this section rely on data aggregated to the country level and a list of countries with favourable corporate tax rates to explore these discrepancies.
Data sources for Indicators 1A & 1B: Data about real and financial economic activity is from Statistics Canada’s Balance of Payments program, specifically the outward foreign direct investment statistics (NDM table 36-10-0008-01) and the activities of Canadian majority-owned affiliates abroad (NDM table 36-10-0470-01). We also used Gross Domestic Product (GDP) by country from the World Bank (World Development Indicators).Note
To identify jurisdictions with favourable corporate tax systems, we used data about foreign subsidiaries of Canadian corporations collected by the Canada Revenue Agency using the T1134 Information Return Relating to Controlled and Not- controlled Foreign Affiliates.
BEPS Indicator 1A: Mismatches between stocks of Canadian outward FDI and GDP of recipient countries for countries with favourable corporate income tax rates
Foreign direct investment (FDI) statistics are commonly used as a proxy for financial activity in BEPS research, although FDI includes both real and financial activity.
FDI is defined by the OECD as a measure of “cross- border investments by a resident of one country (direct investor) in an enterprise (direct investment enterprise) in another country” (OECD 2007). To be considered FDI, investments must represent a lasting interest in the investment enterprise, meaning in practice that the direct investor must have at least 10% ownership of the investment enterprise.
FDI is commonly attracted by market characteristics such as large domestic markets, solid infrastructure, natural resources and a skilled, flexible labour force. However, FDI may also be attracted by what the OECD refers to as framework characteristics, which are more difficult to quantify and describe a jurisdiction’s legal and regulatory environment. These include political stability, predictable and reliable law enforcement, and a favorable tax system (OECD 2007).
Lower tax rates have been empirically associated with increases in FDI, and there is evidence that FDI has become increasingly sensitive to taxation as advances in technology have made capital more mobile (OECD 2007).
This indicator is designed to gauge whether a significant proportion of Canada’s outward FDI is driven by tax minimization. It compares Canada’s outward FDI stock in 2016 to GDP of countries receiving the investments, for countries that have a favourable corporate income tax rates, and for those that do not.
Without BEPS, we expect that the relative size of FDI received by countries with favourable corporate taxation systems (financial economic activity) will be comparable to their proportion of GDP (real economic activity).
Methodology: BEPS research often uses effective tax rates (ETRs) to identify jurisdictions with favourable corporate tax rates, because it is a measure of how much tax is actually paid for each dollar of income. Note To determine whether each of these countries had a favorable corporate income tax rate, we used data from the T1134 return from 2011 to 2016 to calculate the ETR (taxes divided by income)Note for each foreign subsidiary. We weighted these ETRs by the subsidiary’s assets to calculate the average ETR for each country over the period. We sorted countries by ETR, and labelled countries with the lowest- ETRs and up to 20% of the total assets held by foreign subsidiaries as having favourable corporate tax rates.
We also labelled countries with slightly higher ETRs and between 20% and 25% of total assets as having favourable corporate tax systems if they appeared on a list of countries compiled by the United States Government Accountability Office (2008) to study corporate tax evasion that is commonly cited.Note Note
We collected data on the 10 countries with the largest stocks of Canadian outward FDI from Statistics Canada’s FDI statistics program, and obtained GDP for each of these countries from the World Bank’s World Development Indicators table.
We grouped countries according to whether they had favourable corporate tax rates, and added up the FDI and GDP for each group. We presented the sums for each group as a proportion of the total.
Results: A high level of Canadian outward FDI was directed to countries with favourable corporate tax rates in 2016, particularly considering these jurisdictions did not have large economies (Chart 1). This suggests that a fifth of outward FDI may not be attracted by real economic factors.

Data table for Chart 1
| Relative size of outward FDI | Relative size of GDP | |
|---|---|---|
| percent | ||
| Countries with favourable corporate tax rates | 22.3 | 0.3 |
| All other countries | 77.7 | 99.7 |
| Source: Statistics Canada (NDM table 36-10-0008-01) & World Bank (World Development Indicators- GDP). | ||
BEPS Indicator 1B: Mismatches between assets, employment and sales for countries with favourable corporate tax rates
This indicator looks for discrepancies between asset ownership, employment and sales in foreign subsidiaries of MNEs operating in Canada which may be associated with tax minimization. It compares the ratios of employees and sales to assets in subsidiaries operating in countries with favourable corporate income tax rates to those that are not.
Without BEPS, the expectation is that the ratio of employees and sales to assets would be similar whether countries have favourable corporate tax rates or not. Assets that have relatively few employees interacting with them or that are generating relatively low volumes of sales indicate that there is a disconnect between financial and real economic activity.
Methodology: We collected data on total assets, employment and sales for the 10 countries where the subsidiaries of Canadian companies had the most assets from Statistics Canada’s Activities of Canadian majority-owned affiliates abroad program.
We grouped these countries using the list of countries with favorable corporate tax rates from Indicator 1A. We calculated averages of employment and sales per billion dollars’ worth of assets.
Results: In 2016, for countries with favourable corporate tax rates, foreign subsidiaries reported having 23 employees per billion dollars of assets. For the other countries, foreign subsidiaries reported having 270 employees per billion of assets (Chart 2).
Similarly, the ratio of sales to assets was lower in countries with favourable corporate tax rates (38 million dollars per billion of assets) than for the other countries (145 million dollars per billion of assets). These results suggest that investment in countries with favourable corporate tax rates by the subsidiaries of MNEs operating in Canada is not driven by real economic factors.

Data table for Chart 2
| Average number of employees | Average volume of sales | |
|---|---|---|
| millions of dollars | ||
| Countries with favourable corporate tax rates | 23 | 38 |
| All other countries | 270 | 145 |
| Source: Statistics Canada, authors' calculations based on data from NDM table 36-10-0470-01. | ||
Section 2: Profit rate differentials within MNEs
MNE affiliates with low tax rates that are highly profitable relative to their group overall may suggest that some of the group’s income was transferred to minimize taxes. The two indicators in this section are recreated from Action 11 of the OECD’s BEPS Action Plan using data about MNEs operating in Canada and their affiliates abroad.
Data sources for Indicators 2A & 2B: We used financial data about foreign affiliates from the T1134 Information Return Relating to Controlled and Not- controlled Foreign Affiliates. The variables were assets, income and taxes, and data was available for 2011 to 2016.Note
Financial data about the Canadian resident companies filling the T1134 return came from the T2 Corporation Income Tax Returns filed with the Canada Revenue Agency. The variables we used were assets, income and taxes for the same years where we had data from the T1134 available.Note
Combining these data sources allowed us to get a picture of an MNE's financials in Canada and abroad. A limitation was that financial data on foreign parents of the Canadian reporting company and other affiliates of these foreign parents were not available. Note
BEPS Indicator 2A: High profit rates of low-taxed affiliates of MNEs
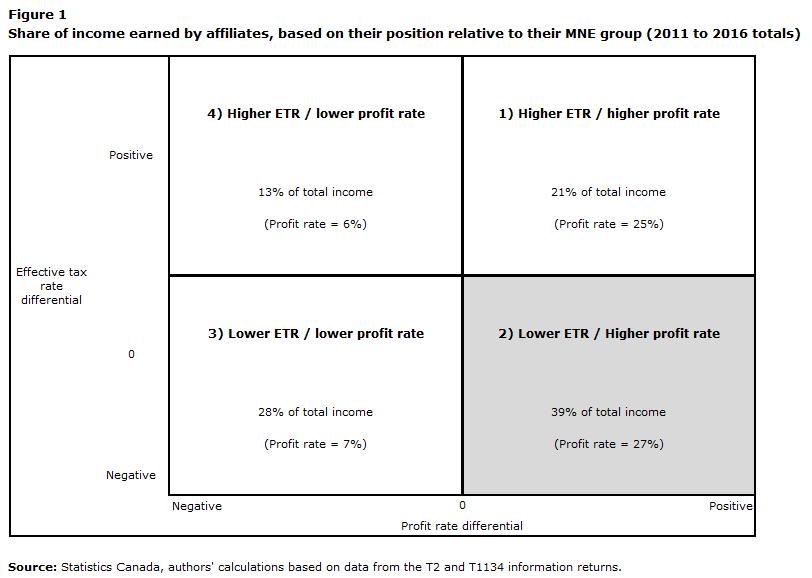
This indicator compares income earned by MNE affiliates that are grouped based on how their profit rates and ETRs compare to their group. A high proportion of total income earned by affiliates with higher profit rates and lower effective tax rates than their groups is a sign of BEPS. This distribution of income suggests that MNEs could have strategically ‘shifted’ income to minimize taxes.
Methodology: The methodology for this indicator is adapted from Indicator 2 in Action 11 of the OECD’s BEPS Action Plan. The OECD study used data from consolidated and unconsolidated financial statements of MNEs, and focussed on the largest 250 MNEs globally (OECD 2015).
Following this methodology, we calculated profit rate (income divided by assets) and ETR for each affiliate, and dropped observations with negative effective tax rates and income.
Next, we calculated profitability and ETR for each MNE group as a whole and compared the ratio of each affiliate to that of its group.Note Based on these results, we sorted affiliates into the following groups (or quadrants):
- Quadrant 1: Higher ETR, higher profitability
- Quadrant 2: Lower ETR, higher profitability
- Quadrant 3: Lower ETR, lower profitability
- Quadrant 4: Higher ETR, lower profitability
We then added up the income earned by the affiliates in each quadrant, and repeated the exercise for each year from 2011 to 2016. Since the results were variable year- over- year, we chose to present our result as an aggregate for the whole period.Note Note
Results: Affiliates with low ETR and high profitability relative to their groups earned the highest proportion of income over the period as a whole, with 39% between 2011 and 2016 (see Figure 1). They were also slightly more profitable on average than highly profitable affiliates with high tax rates relative to their groups.
Year- over- year results were more variable, though each year except 2012 affiliates in the second quadrant earned over 30% of total income. In all years, except 2012 and 2016, affiliates in the second quadrant outearned affiliates in each of the other quadrants. Full results for each year are in Appendix 2.
These results suggest that MNEs that operate in Canada and have at least one foreign affiliate may be distributing their incomes to decrease the taxes they owe globally.
Description for Figure 1
Affiliates with low ETR and high profitability relative to their groups earned the highest proportion of income over the period as a whole, with 39% between 2011 and 2016.
BEPS Indicator 2B: High profit rates of MNE affiliates in lower- tax locations
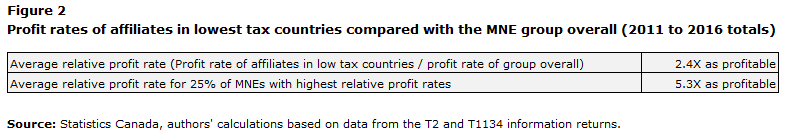
Indicator 2B compares the profit rates of affiliates within an MNE in low- tax areas to the profit rate of the MNE as a whole by calculating relative profit rates for each MNE, and combining these to create an average. If the indicator is above 1, profits are higher in low- tax areas than in high tax areas, meaning that MNEs may be shifting profits to minimize taxation.
Methodology: The methodology for this indicator is adapted from Indicator 3 in Action 11 of the OECD’s BEPS Action Plan.
Following this methodology, we added up assets, income and taxes paid by affiliates to arrive at totals by country for each MNE group. We calculated the ETR by country for each MNE group by dividing the total tax paid by total income. Next, we ranked countries within each MNE by their ETR, and labelled the countries with the lowest ETRs and up to 20% of each MNEs assets as ‘low-tax’.Note
Similarly, we calculated the profit rate by country for each MNE group by dividing the total income by total assets. We weighted profit rates for each affiliate in a ‘low-tax’ country by the total assets in that country and combined them into an average profit rate for each MNEs ‘low-tax’ affiliates.
Next, we added up assets and income by affiliates to arrive at totals for each MNE group, and calculated the overall profit rate for each MNE by dividing the total income by total assets. To obtain relative profit rates for each MNE, we divided the profit rate for the low- tax countries where the group had affiliates by the profit rate for the MNE as a whole.
Finally, we weighted each relative profit rate by the MNEs assets and combined these to obtain an overall average relative profit rate.Note We repeated the exercise for each year from 2011 to 2016. As with Indicator 2A, results were variable year- over- year and we chose to present them for the period as a whole.Note
We also calculated a weighted overall average relative profit rate for the 25% of MNEs with the highest relative profitability.
Results: We found that between 2011 and 2016, MNE affiliates in low-tax countries were more than twice as as profitable as their groups overall (see Figure 2). The quarter of MNEs with the largest discprencies in profitability between affiliates in low- tax countries and the group overall had average relative profit rates of over 5, meaning that affiliates in low- tax countries were 5 times as profitable as their groups overall.
As with Indicator 2, the relative profit rates varied year- over- year. In 2013, affiliates in low- tax countries were only 1.7 times as profitable as their groups, while in 2015 they were 3.3 times as profitable. See Appendix 3 for results by year.
These results suggest that MNEs that contain a Canadian parent (not necessarily the ultimate parent) and foreign affiliates may be distributing their incomes to decrease the taxes they owe globally.
Description for Figure 2
MNE affiliates in low-tax countries were 2.4 times as as profitable as their groups overall . The quarter of MNEs with the largest discprencies in profitability between affiliates in low- tax countries and the group overall had average relative profit rates of 5.3.
Section 3: MNE vs ‘comparable’ non-MNE effective tax rate differentials
BEPS Indicator 3: Effective tax rates of MNEs relative to non-MNE entities with similar characteristics
Unlike other BEPS indicators which focus on activities that reduce net income in countries where tax rates are high, indicator 3 is designed to detect whether MNEs take advantage of their capacity to shift income to other jurisdictions, to minimize their tax rate. Lower ETRs for MNEs may also reflect non-BEPS behaviours such as the decision to carry out substiantial activity to benefit from certain preferential tax treatments (e.g. R&D tax subsidies, investment tax credits).
The indicator compares ETRs for two types of MNEs operating in Canada to ETRs for comparable enterprises without subsidiaries or parents abroad.
Data sources: We used consolidated financial statements of enterprises operating in Canada from the Annual Financial Taxation Statistics program, specifically the financial variables total assets, net income before taxes, and federal tax payable for 2011 to 2016. These data are consolidated at the enterprise level and cover activities that are ‘booked in Canada’.
We also used a new ‘flag’ to identify MNEsNote which was developed in collaboration with Statistics Canada’s International Accounts and Trade Division. It relies on tax data to identify MNEs with affiliates abroad, and the data collected under the Corporate Returns Act to identify enterprises with foreign parents.
Methodology: The methodology for this indicator is adapted from Indicator 4 in Action 11 of the OECD’s BEPS Action Plan. The OECD study used data from unconsolidated financial statements of MNEs and non-MNEs worldwide (OECD 2015).
To recreate this indicator for Canada, we set up the data for analysis by labelling enterprises as ‘large’ if they had over 25 million in total assetsNote . Following OECD methodology, we dropped all observations with negative total assets, net income, and taxes.
We calculated ETRNote and profit rate for each enterprise, and sorted enterprises into six groups based on their characteristics: non-MNEs or enterprises without affiliates abroad (large and small), and two types of MNEs: Canadian- owned enterprises with one or more foreign affiliates (large and small) and foreign- owned enterprises (large and small). To discover whether differences between these 6 groups were statistically significant, we ran a regression that controlled for industry and profitability.Note
We present our findings as the differential between ETRs for comparable MNEs and non-MNEs for 2016, because results were stable year-over-year.
Results: In 2016, ETR was lower for large Canadian- owned enterprises with foreign subsidiaries than for comparable non- MNEs, and the difference was statistically significant at the 95% level when controlling for profitability and industry. ETR was higher for foreign- owned enterprises than for comparable non-MNEs.
No differences in ETRs for small enterprises operating in Canada were statistically significant.
This could be a sign of tax minimization by the MNEs with affiliates abroad, but more research is required to discover whether the differential is due to these enterprises taking more deductions in Canada as a proportion of their net income than domestic- only enterprises. The consolidated data was not sufficiently detailed for this research.
| Year | Canadian-owned enterprises with one or more foreign subsidiaries | Foreign-owned enterprises |
|---|---|---|
| percent | ||
| 2016 | -1.9 | 3.2 |
| Source: Statistics Canada, authors' calculations based on data from the Annual and Financial Taxation Statistics (AFTS). | ||
Section 4: Conclusions and suggestions for additional research
In conclusion, many of the indicators we created suggest that MNEs with operations in Canada may have used strategies to minimize the amount of taxes they owed globally between 2011 and 2016, but further research needs to be done to understand the extent of the impacts of these behaviours on taxation revenues in Canada.
The indicators in section 1 demonstrate that there are mismatches between the locations of real and financial activities of MNEs with operations in Canada, which suggests that some investment abroad is motivated by tax concerns. Considering how small the economies of countries with favourable corporate tax rates are, they have high stocks of Canadian FDI. Affiliates (of MNEs operating in Canada) in countries with favourable corporate tax rates also have low levels of employment and sales relative to assets, compared with subsidiaries in other countries.
Both indicators in section 2 demonstrate that for those MNEs operating in Canada and having foreign affiliates, their affiliates with low ETRs are highly profitable relative to their groups. These results, which are more pronounced in some years, suggest that profits have been ‘shifted’ to lower tax locations. Indicators in section 2 do not attempt to isolate the locations of the low ETR affiliates, which could be the Canadian firm at the top of the MNE in some cases. Although the results imply that MNEs are reducing their tax bases globally, more research could help to understand how this impacts tax revenues in Canada.
The indicator in section 3 demonstrates that there are statistically significant differences between ETRs for large MNEs and non-MNEs operating in Canada. Large foreign-owned enterprises operating in Canada had higher tax rates than comparable non-MNEs while large Canadian-owned enterprises with subsidiaries abroad had lower effective tax rates. Further research with more detailed data is required to determine whether the low ETRs could be due to BEPS behaviours.
Appendix 1: Data sources for Indicators 1A and 1B
Outward foreign direct investment statistics are available from Statistics Canada in NDM table 36-10-0008-01.
GDP statistics by country are available from the World Bank’s World Development Indicators DataBank
Activities of Canadian majority-owned affiliates abroad are available from Statistics Canada in NDM table 36-10-0470-01.
Appendix 2: Indicator 2A year- over- year
| Year | Quadrant | Income earned by affiliates in each quadrant |
|---|---|---|
| In percent | ||
| 2011 | 1 | 26 |
| 2 | 32 | |
| 3 | 26 | |
| 4 | 16 | |
| 2012 | 1 | 35 |
| 2 | 28 | |
| 3 | 27 | |
| 4 | 10 | |
| 2013 | 1 | 22 |
| 2 | 37 | |
| 3 | 30 | |
| 4 | 12 | |
| 2014 | 1 | 19 |
| 2 | 48 | |
| 3 | 23 | |
| 4 | 11 | |
| 2015 | 1 | 19 |
| 2 | 46 | |
| 3 | 20 | |
| 4 | 16 | |
| 2016 | 1 | 15 |
| 2 | 35 | |
| 3 | 38 | |
| 4 | 12 | |
| Source: Statistics Canada, authors' calculations based on data from the T2 and T1134 information returns. | ||
Appendix 3: Indicator 2B year- over- year
| Year | Relative profit rate |
|---|---|
| 2011 | 1.8X as profitable |
| 2012 | 2.8X as profitable |
| 2013 | 1.7X as profitable |
| 2014 | 2.7X as profitable |
| 2015 | 3.3X as profitable |
| 2016 | 2.1X as profitable |
| Source: Statistics Canada, authors' calculations based on data from the T2 and T1134 information returns. | |
References
Dharmapala, D. and Hines, D. (2006) “Which Countries Become Tax Havens?”, NBER Working Paper Series, Working Paper 12802.
Fortier-Labonté, A. and Schaffter, C. (2019) “Multinational Enterprises in Canada”, Statistics Canada Analysis in Brief, 11-621 M.
International Monetary Fund (IMF) (2000) “Offshore Financial Centers”, IMF Background paper.
IMF (2008) Offshore Financial Centers: A Report on the Assessment Program and Proposal for Integration with the Financial Sector Assessment Program. IMF Monetary and Capital Markets Department.
Organization for Economic Cooperation and Development (OECD) (n.d.) Myths and Facts about BEPS.
OECD (2007) “Tax effects on Foreign Direct Investment” Recent Evidence and Policy Analysis series. No. 17.
OECD (2015) Measuring and Monitoring BEPS, Action 11 - 2015 Final Report. OECD/G20 Base Erosion and Profit Shifting Project, OECD Publishing, Paris.
United States Government Accountability Office (2008) Large U.S. Corporations and Federal
Contractors with Subsidiaries in Jurisdictions Listed as Tax Havens or
Financial Privacy Jurisdictions, Report to Congressional Requesters. GAO-09-157.
Warren, Paul. 2005. “Profitability of Canadian- versus U.S. - Controlled Enterprises”, Statistics Canada Economic Analysis Research Paper Series. No. 11F00027MIE030.
- Date modified: