
Analysis in Brief
Where did Vancouverites Go to Shop in 2016?: A Snapshot of Vancouver Retail Store Sales by Shopping Centre Type

Archived Content
Information identified as archived is provided for reference, research or recordkeeping purposes. It is not subject to the Government of Canada Web Standards and has not been altered or updated since it was archived. Please "contact us" to request a format other than those available.
by Carey Olineck
Skip to text
Text begins
Evolution of the Canadian Retail Sector and the Implications for Brick-and-Mortar Retailers
The rapid expansion of e-commerce is playing a significant role in the evolution of the Canadian retail sector. From 2012 to 2015, e-commerce retail sales in Canada grew by 39.5%.Note 1 In comparison, in-store retail sales grew by only 14.2% during the same period.Note 2 While these trends suggest a diminishing role for brick-and-mortar retailers, they do not tell the whole story.
First, while e-commerce retail sales are growing faster than in-store sales, e-commerce retail sales represent a very small portion of overall retail sales – they represented only 2.2% of all retail sales in 2016.Note 3 Second, many brick-and-mortar retailers are adopting an omni-channel retail strategy, where they are maintaining their physical storefronts and simultaneously establishing their own websites to compete in the world of online shopping. Third, some e-commerce retailers are establishing their own traditional brick-and-mortar stores to complement their online business. Finally, to encourage foot traffic at their malls, shopping centre owners are trying to revamp the shopping centre experience by offering more non-retail services like food and entertainment, or adopting mixed-use strategies such as incorporating residential elements in their design.
One implication of these developments is that it is likely that brick-and-mortar retailers will continue to maintain a physical storefront presence, in some cases locating to a shopping centre. Consequently, it is important to have information on the sales of retailers located in shopping centres because this can aid both urban planners and shopping centre developers in considering future shopping centre developments. This note provides a snapshot of how retail sales in the Census Metropolitan Area (CMA) of Vancouver were distributed between retailers located in shopping centres and those in stand-alone storefronts in 2016.
Overview of the Vancouver Retail Store Market
One reason for selecting the Vancouver CMA to conduct this research is the city has a rapidly expanding retail market, driven in part by strong population growth. From 2004 to 2016, retail stores in the Vancouver CMA increased their sales from $22.2 billion to $36.0 billion, a rise of 62.0%.Note 4 During the same period, the Vancouver CMA’s population grew from 2.1 million inhabitants to 2.6 million inhabitants, a rise of 19.4%.Note 5 Moreover, population projections suggest that the Vancouver CMA could see a further 26.4% increase in its population in the next 20 years, which will likely increase the need for planning the location of future shopping centre developments.Note 6
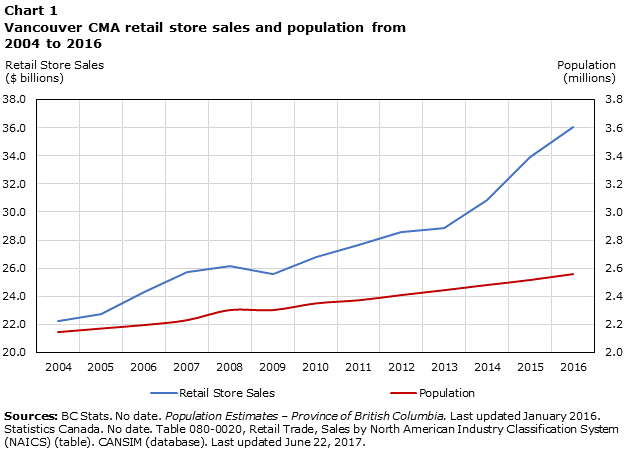
Data table for Chart 1
| Population | Retail Store Sales | |
|---|---|---|
| Year | ||
| 2004 | 2,147,959 | 22,243,756 |
| 2005 | 2,173,374 | 22,765,932 |
| 2006 | 2,198,235 | 24,302,853 |
| 2007 | 2,232,067 | 25,735,740 |
| 2008 | 2,303,653 | 26,121,102 |
| 2009 | 2,303,653 | 25,612,682 |
| 2010 | 2,351,205 | 26,765,736 |
| 2011 | 2,373,037 | 27,636,661 |
| 2012 | 2,410,104 | 28,554,336 |
| 2013 | 2,444,454 | 28,886,542 |
| 2014 | 2,481,148 | 30,832,370 |
| 2015 | 2,516,560 | 33,880,923 |
| 2016 | 2,558,029 | 36,044,706 |
Types of Shopping Centres
There are ten major types of shopping centres which can be grouped into four common categories – traditional, speciality, retail hybrid, and retail mixed-use. Shopping centres can in turn be grouped according to characteristics such as size, number of anchors, dominant use or concept, and catchment or trade area for potential customers. This trade area can vary in distance depending on the type of shopping centre (see Table 1 below for a description of these characteristics).Note 7
| Shopping Centre Type | Gross Leasable Area (sq. ft.) | Major Features | Trade Area (kilometres) |
|---|---|---|---|
| Traditional Shopping Centres | |||
| Super-regional Mall | over 800,000 | Usually enclosed with combination of anchors, but offering a wider mix than regional malls. | 10 km to 30 km |
| Regional Mall | 300,000 to 799,999 | Usually enclosed with a combination of anchors. | 8 km to 20 km |
| Community Centre | 100,000 to 400,000 | Open-air centre in which tenants provide products and services for day-to-day needs, but offer a wider array than neighbourhood centres. | 5 km to 8 km |
| Neighbourhood Centre | 40,000 to 99,999 | Open-air centre that is designed to provide day-to-day goods. | within 5 km |
| Convenience Centre | 10,000 to 39,999 | Open-air centres in which tenant provides narrow mix of goods. | within 2 km |
| Specialty Shopping Centres | |||
| Power Centre | 100,000 to 1,000,000 | Open-air centre that often comprises three or more large format retailers (big box stores). | 8 km to 20 km |
| Factory Outlet | 50,000 to 400,000 | Consists of separate manufacturers and retailers selling their own brand-name goods at discount prices. | 20 km to 50 km |
| Lifestyle Centre | minimum 50,000 | Often located in affluent residential neighbourhoods catering to the needs of customers in trading area. | 10 km to 20 km |
| Retail Hybrid | minimum 250,000 | Combines predominant elements from two or more distinct traditional and/or speciality shopping centre types. | varies depending on composition |
| Retail Mixed-use | minimum 50,000 | Combines predominant elements from two or more distinct traditional and/or speciality shopping centre types. | varies depending on composition |
| Source: International Council of Shopping Centers. 2010. Canadian Retail Real Estate Standard: A Framework for Shopping Centre and Other Retail Format Definitions. Last updated December 2010. | |||
Number of Shopping Centres in the Vancouver CMA in 2016
| Number | Percentage | |
|---|---|---|
| Shopping Centre Type | ||
| Neighborhood Centre | 80 | 38.3 |
| Community Centre | 45 | 21.5 |
| Retail Mixed-Use | 35 | 16.7 |
| Convenience Centre | 14 | 6.7 |
| Power Centre | 14 | 6.7 |
| Regional Mall | 12 | 5.7 |
| Lifestyle Centre | 4 | 1.9 |
| Super-Regional Mall | 4 | 1.9 |
| Retail Hybrid | 1 | 0.5 |
| Factory Outlet | 0 | 0.0 |
| Total | 209 | 100.0 |
| Source: Monday Report’s Canadian Directory of Shopping Centres. 2016. Number of Shopping Centres by Type in the Vancouver CMA for 2016. (database). | ||
In Vancouver, there were 209 shopping centres in 2016.Note 8 The predominant type was the neighbourhood centre, which accounted for 38.3% of shopping centres in Vancouver (see Table 2).
While super-regional malls are typically the largest type of shopping centre in terms of gross leasable area, few major metropolitan areas can support more than a handful, and Vancouver is no exception, with 4 super-regional malls.
An additional factor why most large metropolitan areas have few super-regional malls is that with a large portion of population growth occurring in suburbs, shopping centre developers have focused on the development of other shopping centre types like power centres, which are open-air centres between 200,000 to 1,000,000 square feet. A power centre can be comprised of several anchors, which are mainly medium- and large-scale retailers (e.g. big-box stores) that may be freestanding or connected.
Number of Retail Stores in the Vancouver CMA
In 2016, there were 9429 retail stores operating in the Vancouver CMA. Of these, 23.0% or 2,173 retailers were located in one of the seven shopping centre types included in this study (super-regional, regional, community, power, retail mixed-use, retail hybrid, or lifestyle). The remaining 77.0% of retailers were either operating stand-alone stores or located in the two shopping centre types not included in this study: neighbourhood centres and convenience centres.
Shopping Centre Retailers Play a Large Role in Many Retail Industries
At the retail sector level, retailers located in a shopping centre accounted for 23.1% of the Vancouver CMA’s retail store sales in 2016.
At the retail subsector level, shopping centre retailers play a significant role in many store types (see Chart 2). For example, amongst clothing and clothing accessories stores, 61.3% of the subsector’s sales were generated by retailers located in a shopping centre. The next highest share are shopping centre retailers in the electronics and appliance subsector, at 46.1%.
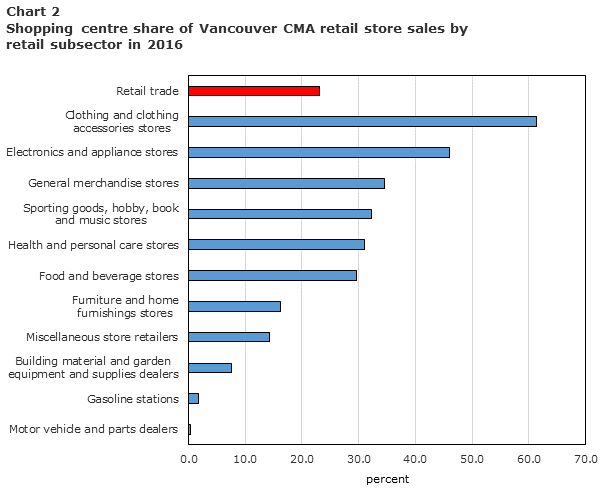
Data table for Chart 2
| Retail Store Sales | Sales of Retailers in a Shopping Centre | Percent | |
|---|---|---|---|
| Retail trade | 36,044,706,000 | 8,342,199,862 | 23.1 |
| Clothing and clothing accessories stores | 3,419,308,000 | 2,096,034,064 | 61.3 |
| Electronics and appliance stores | 1,690,377,000 | 778,540,389 | 46.1 |
| General merchandise stores | 3,799,680,000 | 1,314,034,299 | 34.6 |
| Sporting goods, hobby, book and music stores | 1,132,829,000 | 365,187,115 | 32.2 |
| Health and personal care stores | 3,003,319,000 | 930,093,340 | 31.0 |
| Food and beverage stores | 7,626,310,000 | 2,260,096,826 | 29.6 |
| Furniture and home furnishings stores | 1,642,942,000 | 266,254,082 | 16.2 |
| Miscellaneous store retailers | 1,012,806,000 | 143,969,720 | 14.2 |
| Building material and garden equipment and supplies dealers | 1,546,697,000 | 116,580,520 | 7.5 |
| Gasoline stations | 2,361,442,000 | 43,089,506 | 1.8 |
| Motor vehicle and parts dealers | 8,808,996,000 | 28,320,002 | 0.3 |
There are also retail subsectors where store retailers do not typically locate their operations in a shopping centre. One example is motor vehicle and parts dealers, where less than 0.3% of the subsector’s sales were made by retailers located in a shopping centre. Retailers in this subsector do not usually locate in a shopping centre because of the basic characteristics of their products. Cars and recreational vehicles, being large in physical size, require a large amount of floor space. Given the high cost of shopping centre rental space, the basic business model of these types of retailers tends to favour stand-alone stores, usually located outside of the main urban core of most metropolitan centres.
Number of Retail Stores by Shopping Centre Type
If one excludes motor vehicle and parts dealers, as well as gasoline stations from the analysis, 26.7% of retail stores in the remaining subsectors are located in the seven types of shopping centre types included in this study. Of the 2,154 retail stores classified to a shopping centre, 30.2% were located in regional malls, 26.8% in super-regional malls, 19.5% in community centres, 11.7% in retail mixed-use, 8.5% in power centres, and the remaining 3.3% was split between lifestyle and retail hybrid shopping centres (see Chart 3).
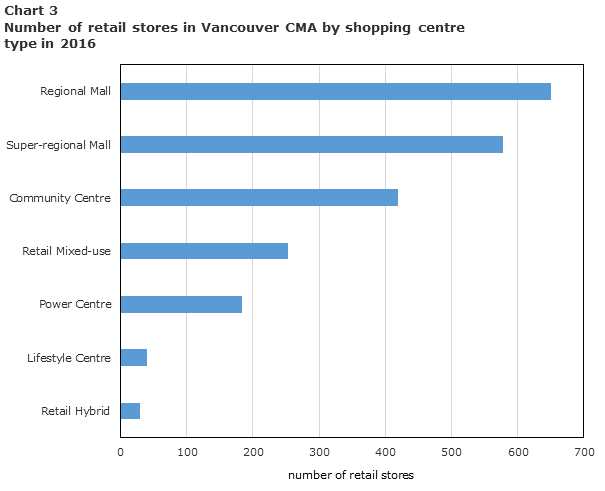
Data table for Chart 3
| Number of retail stores | |
|---|---|
| Shopping Centre Type | |
| Regional Mall | 651 |
| Super-regional Mall | 578 |
| Community Centre | 419 |
| Retail Mixed-use | 253 |
| Power Centre | 183 |
| Lifestyle Centre | 40 |
| Retail Hybrid | 30 |
| Total | 2154 |
Retail Store Sales by Shopping Centre Type
Excluding the above mentioned industries and shopping centre types, retailers located in a shopping centre generated $8.2 billion in retail sales, accounting for 33.3% of all retail store sales in Vancouver during 2016. With $1.9 billion in sales, retailers located in super-regional malls accounted for the largest share of retail store shopping centre sales (see Chart 4). Super-regional malls account for such a large share of retail store sales as they are large in terms of the size of their rental space, with more retailers than other shopping centre types, except regional malls.
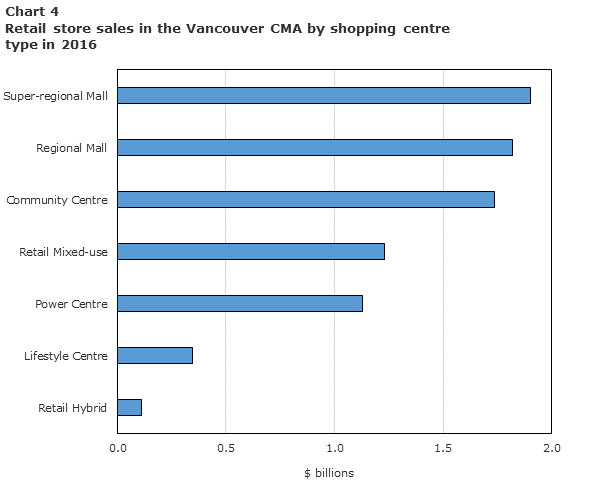
Data table for Chart 4
| $ Billions | |
|---|---|
| Shopping Centre Type | |
| Super-regional Mall | 1,902,106,511 |
| Regional Mall | 1,818,855,220 |
| Community Centre | 1,735,730,735 |
| Retail Mixed-use | 1,230,975,681 |
| Power Centre | 1,130,186,055 |
| Lifestyle Centre | 343,794,778 |
| Retail Hybrid | 109,141,375 |
| Total | 8,270,790,354 |
Summary
Retailers located in shopping centres accounted for almost a quarter of the retail store sales in the Vancouver CMA in 2016. If one excludes those retail subsectors where store retailers tend to locate in stand-alone locations, like motor vehicles and parts dealers and gasoline stations, over a third of retail store sales were accounted for by retailers located in the seven shopping centre types included in this study.
While store retailers located in a shopping centre play a large role in the Vancouver retail store market, they are most prevalent in subsectors like clothing and clothing accessories stores and electronics and appliances dealers.
Amongst the various shopping centre types classified, retailers located in super-regional and regional malls, as well as, community centres accounted for a significant share of the retail stores sales made by retailers located in a shopping centre in Vancouver in 2016.
Start of text boxThe shopping centre type was added as an attribute to the frame of retail stores for the CMA of Vancouver by cross referencing retail stores on Statistics Canada’s frame with the listings of retail stores on the websites of shopping centres. Where a shopping centre did not have a web-site, the research was undertaken using the postal code of retailers on the frame and Google map view.
In this study, only businesses which are in the retail store sector are included in the retail sales of shopping centres. All other types of businesses providing services like banking, food services (e.g. sit down full service restaurants or restaurants in a food court), etc. located in shopping centres are excluded from this study.
Terminology
Shopping Centre
A shopping centre is a retail property that is planned, built, owned and managed as a single entity, comprising commercial units, with a minimum size of 10,000 square feet of gross leasable area.
Census Metropolitan Area (CMA)
A census metropolitan area or CMA is formed by one or more adjacent municipalities centred on a population centre known as the core. A CMA must have a total population of at least 100,000 of which 50,000 or more must live in the core.
Gross Leasable Area (GLA)
Gross leasable area refers to the retail space a retailer occupies and it is measured to include only the total floor area designed for a tenant’s occupancy and exclusive use, measured from the centreline of joint partitions to the centre of the outside walls, and includes both owned and leased space.
Bibliography
BC Stats. No date. Population Estimates – Province of British Columbia. Last updated January 2016.
http://www2.gov.bc.ca/gov/content/data/statistics/people-population-community/population/population-estimates (accessed June 23, 2017).
BC Stats. No date. Population Projections, British Columbia and Sub-provincial – BC Stats. Last updated August, 2016.
http://www.bcstats.gov.bc.ca/apps/PopulationProjections.apsx (accessed June 23, 2017).
International Council of Shopping Centers. 2010. Canadian Retail Real Estate Standard: A Framework for Shopping Centre and Other Retail Format Definitions. Last updated December 2010.
https://c.ymcdn.com/sites/www.realpac.ca/resource/resmgr/research/icsc-canadianshopping-centre.pdf (accessed June 15, 2017).
Monday Report’s Canadian Directory of Shopping Centres. 2016. Number of Shopping Centres by Type in the Vancouver CMA for 2016. (database).
Statistics Canada. No date. Table 080-0032 Retail Trade, Total Sales and E-commerce Sales (table). CANSIM (database). Last updated July 20, 2017.
http://www5.statcan.gc.ca/cansim/a26?lang=eng&retrLang=eng&id=0800032&&pattern=&stByVal=1&p1=1&p2=50&tabMode=dataTable&csid= (accessed July, 21, 2017).
Statistics Canada. No date. Table 080-0031, Annual Retail Trade, Method of Sale (table). CANSIM (database). Last updated July 20, 2017.
http://www5.statcan.gc.ca/cansim/a26?lang=eng&retrLang=eng&id=0800031&&pattern=&stByVal=1&p1=1&p2=50&tabMode=dataTable&csid= (accessed July 21, 2017).
Statistics Canada. No date. Table 080-0033, Retail E-commerce Sales, Unadjusted (table). CANSIM (database). Last updated June 22, 2017.
http://www5.statcan.gc.ca/cansim/a26?lang=eng&retrLang=eng&id=0800033&&pattern=&stByVal=1&p1=1&p2=50&tabMode=dataTable&csid= (accessed June 29, 2017).
Statistics Canada. No date. Table 080-0020, Retail Trade, Sales by North American Industry Classification System (NAICS)(table). CANSIM (database). Last updated June 22, 2017.
http://www5.statcan.gc.ca/cansim/a26?lang=eng&retrLang=eng&id=0800020&&pattern=&stByVal=1&p1=1&p2=50&tabMode=dataTable&csid= (accessed July 21, 2017).
- Date modified: