
Analysis in Brief
Local Manufacturing Data:
A longitudinal analysis of manufacturing sales and employment for Canada’s largest CMAs

Archived Content
Information identified as archived is provided for reference, research or recordkeeping purposes. It is not subject to the Government of Canada Web Standards and has not been altered or updated since it was archived. Please "contact us" to request a format other than those available.

by Sebastien Chiasson and Javad Sadeghzadeh
Note to readers
- Annual Survey of Manufacturing and Logging Industries (ASMLL):
http://www23.statcan.gc.ca/imdb/p2SV.pl?Function=getSurvey&SDDS=2103 - NAICS definitions:
http://stds.statcan.gc.ca/naics-scian/2007/ts-rt-eng.asp?criteria=31-33 - CMA definitions:
http://www12.statcan.gc.ca/census-recensement/2011/ref/dict/geo009-eng.cfm
Note of appreciation
This study would not have been possible without the assistance of a number of analysts at Statistics Canada. The authors greatly appreciate the willingness of others to provide advice, assist with technical issues, and give freely their time to review various drafts of this paper.
Drafts were reviewed by Michael Schimpf, Guy Gellatly, Antoine Rose and Jeffrey Smith. Their feedback and ideas were very helpful for improving the text, tables and charts. Michael Schimpf also provided overall guidance and management for this project.
Mark Stinner provided very useful assistance and guidance in developing a confidentiality pattern for the CMA-level data.
The authors also extend thanks to Bechir Oueriemmi, Maria Del Corral, Cory Timmons, and Elizabeth Chretien for reviewing the text for editorial purposes and for assisting with data verification and formatting charts and tables.
Abstract
Local level manufacturing data can be used to examine manufacturing structure aat the Census Metropolitan Area (CMA) level and differences in their manufacturing activities. This paper developed and analyzes an experimental local-level manufacturing database containing sales and employment for 11 Census Metropolitan Areas (CMA) in Canada for the period 2007 to 2012. The findings indicate that manufacturing sales of the Prairie provinces’ CMAs and those of the Québec CMA grew between 2007 and 2012. The refining of petroleum and the manufacturing of fabricated metals and machinery were the key to their growth of sales.
1. Introduction
The concentration of economic activities and population in large cities increases the need for local level-data. Local-level data are used to measure and compare economic activities of smaller regions and are an important tool for governments when making policies and setting priorities. Local-level data also provide valuable input for analytical research and study of regional development to both public and private institutions, as well as international organizations such as the Organisation for Economic Co-operation and Development (OECD).
Recently, more attention has been given to the compilation and development of local-level data among statistical agencies around the world. The Statistical Office of the European Union (Eurostat) uses a harmonized methodology to measure economic indicators at the regional level. The data are used for economic planning and policy analysis in the European Union. Statistics Canada collects and produces many socio-economic indicators such as population, employment, housing prices, health indicators, and income at the Census Metropolitan Area (CMA) levelNote 1. The Conference Board of Canada also estimates and publishes quarterly gross domestic product (GDP) for CMAsNote 2. Despite having many socio-economic indicators available at the local level in Canada, insufficient local level business data poses a challenge for policy makers. For example, the federal government uses local-level data to allocate resources across infrastructure projects such as subways and light rail in cities or gives more attention to industries that contribute more to the economy at the local level. Local-level business data are also important for provincial governments as they analyze structural change in provincial economies and develop region-specific policies to meet new challenges.Note 3
In recent years, experimental research has been conducted at Statistics Canada to develop new local-level databases. For example, Desmond, Brown and Gellatly (2008) estimated local-level human capital and studied the contribution of human capital to long-run employment growth from 1980 to 2000 in Canadian and U.S. cities. Brown and Rispoli (2014) employed a new experimental metric to measure the contribution to GDP by Canadian CMAs between 2001 and 2009, and estimated GDP in 33 CMAs.
This paper analyzes an experimental local-level manufacturing database containing sales and employment information for 11 Census Metropolitan Areas (CMA) for the period 2007 to 2012. The CMAs covered in this study are Vancouver, Calgary, Edmonton, Regina, Saskatoon, Winnipeg, Hamilton, Toronto, Ottawa-Gatineau, Montréal and Québec. They account for about 55% of total population in Canada. Given the diversity of local-level economies across Canada, even within provinces, developing manufacturing data for CMAs has the potential to fill an important data gap.
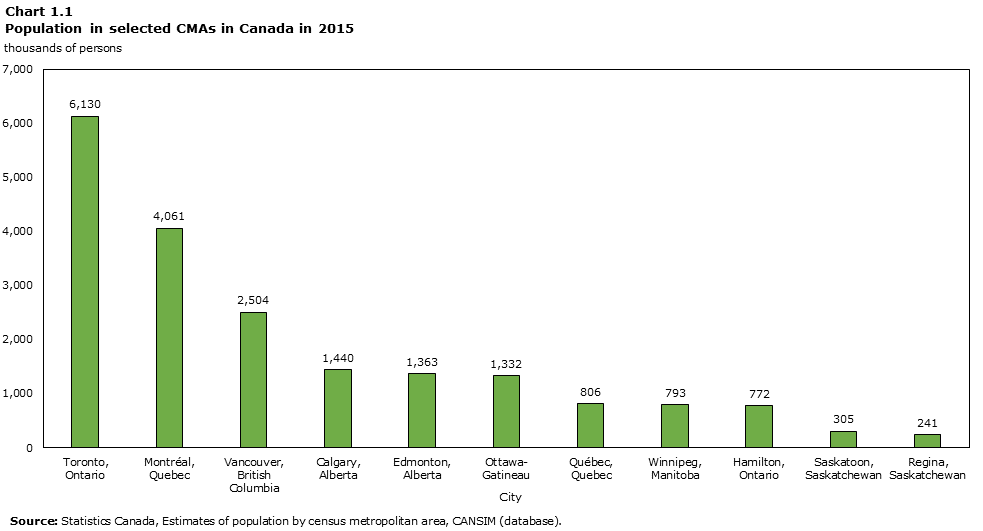
Data table for Graph 1.1
| City | Thousands of persons |
|---|---|
| Toronto, Ontario | 6,130 |
| Montréal, Quebec | 4,061 |
| Vancouver, British Columbia | 2,504 |
| Calgary, Alberta | 1,440 |
| Edmonton, Alberta | 1,363 |
| Ottawa-Gatineau | 1,332 |
| Québec, Quebec | 806 |
| Winnipeg, Manitoba | 793 |
| Hamilton, Ontario | 772 |
| Saskatoon, Saskatchewan | 305 |
| Regina, Saskatchewan | 241 |
| Source: Statistics Canada, Estimates of population by census metropolitan area, CANSIM (database). | |
The local level manufacturing data developed for this study are able to show the manufacturing structure of major cities in Canada and differences in manufacturing activities across CMAs that currently cannot be gleaned from other databases. The local-level data also demonstrate trends in manufacturing employment across cities and have great potential for advancing the understanding of the Canadian economy.
The rest of the paper is organized as follows. Section 2 describes the data source and the methodology employed to derive estimates by CMA. Section 3 provides an analysis of the estimates, followed by conclusions in section 4. A series of tables in the Appendix provide local-level data and may be used for reference purposes.
2. Data and Methodology
Data used in this study come from the Annual Survey of Manufacturing and Logging (ASML). The ASML is a survey of manufacturing industries covering all manufacturing establishments in Canada. Currently, manufacturing statistics are published at the national and provincial levels by industry. Yet, some CMAs in Canada have manufacturing sectors that are larger, as measured by sales, than some of the smaller provinces.
As a result of changes in methodology to the ASML for reference year 2013, this paper examines the evolution of manufacturing sales and employment for the 11 selected CMAs between 2007 and 2012.
The paper focuses on the analysis of sales and employment. Sales are a key measure of output of the manufacturing sector, and employment is a main input to manufacturers’ production functions. Other inputs, such as tangible and intangible capital, and materials are also relevant; however, they were not examined in this paper.Note 4 Finally, data in this paper are compiled according to the North American Industrial Classification System (NAICS).
Throughout the paper, jobs refer to employment in manufacturing establishments, including direct manufacturing labour as well as support staff, such as management and office staffNote 5. An establishment, according to the ASML methodology, is an operating entity where profit from its principal business activity can be calculated. While an enterprise may own multiple establishments including warehouses, factories, and sales offices, only data from manufacturing establishments are considered in-scope and collected.
Up to 2012 reference year, the ASML was a census of manufacturers which made it particularly suitable for compiling estimates at detailed geographical levels. As of 2013, it became a sample-based surveyNote 6 designed to support national and provincial level data which would require the development of more sophisticated econometric techniques to derive sub-provincial indicators.
Each manufacturing establishment in the ASML database is already coded by CMA and each CMA has a specific numeric code assigned to it according to the Standard Geographic Classification. Since addresses sometimes change, this paper used the census 2006 Standard Geographic Classification of CMA codes. If 2006 code was not available, the code for the most recent year was used. These codes were used to aggregate the ASML microdata (sales and employment for each establishment) to produce industry estimates for each CMA. Different techniques were used to ensure the assignment of manufacturing establishments to geographic areas was reliable and accurate. In particular, the locations of large establishments in each CMA were verified. About 25 large establishments did not seem to fit their assigned CMAs, according to Google Maps and other information sources. Companies outside of the CMAs were excluded from the analysis.
Not all manufacturing data for industries at the CMA level can be published due to the confidentiality requirements of the Statistics Act. Hence, industry-level data, particularly for smaller CMAs including cities in the Atlantic Provinces, must remain confidential.
Data for the smallest manufacturing plants in the ASML are based on administrative records and compiled as industry-province blocks and, hence, their microdata are not available. For these cases, administrative information was used to distribute data across CMAs. In particular, data from tax files were used to estimate, by industry, the relative sizes of CMAs within the provinces, and the provincial blocks were allocated accordingly.
3. Data Analysis
This section analyzes sales and employment data for the 11 selected CMAs across Canada. The data are compared with the relevant provincial level data to show how cities are similar or divergent from their respective provinces.
3.1 British Columbia and Vancouver
British Columbia (B.C.) is the third-largest province in Canada in terms of population and area. In terms of GDP, manufacturing is the third largest sector in B.C. after real estate services and rental and leasing services. In 2012, the British Columbia manufacturing sector was responsible for 8.0% of national manufacturing GDP. When examining GDP at a national level for all economic sectors, British Columbia contributed 12.1%.
Total manufacturing sales in B.C. decreased from $43.1 billion in 2007 to $40.7 billion in 2012. The largest manufacturing industries (measured by sales) in British Columbia are the wood, food, and the paper industries. The local data show that Vancouver accounted for around half of British Colombia’s manufacturing sales in both 2007 and 2012.
Manufacturing sales in Vancouver CMA did not change significantly between 2007 and 2012. During this period, manufacturing sales in Vancouver area fell slightly from $21.5 billion in 2007 to $20.9 billion in 2012.
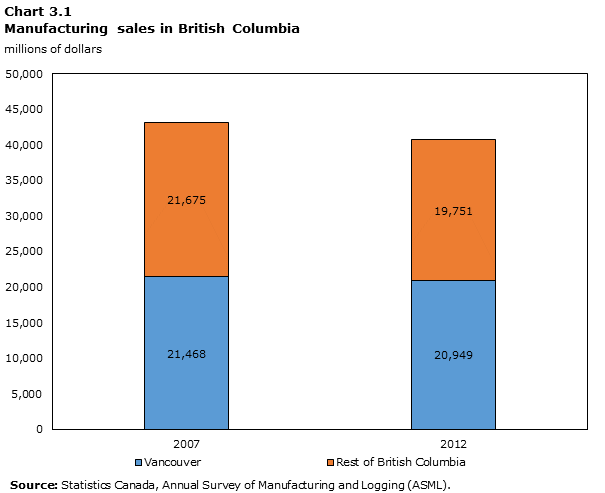
Data table for Graph 3.1
| City | 2007 | 2012 |
|---|---|---|
| millions of dollars | ||
| Vancouver | 21,468 | 20,949 |
| Rest of British Columbia | 21,675 | 19,751 |
| Source: Statistics Canada, Annual Survey of Manufacturing and Logging (ASML). | ||
For the majority of manufacturing industries present in B.C., Vancouver accounts for over half of their sales. The Beverage and Tobacco (312), Wood (321) and Paper (322) industries are the notable exceptions.
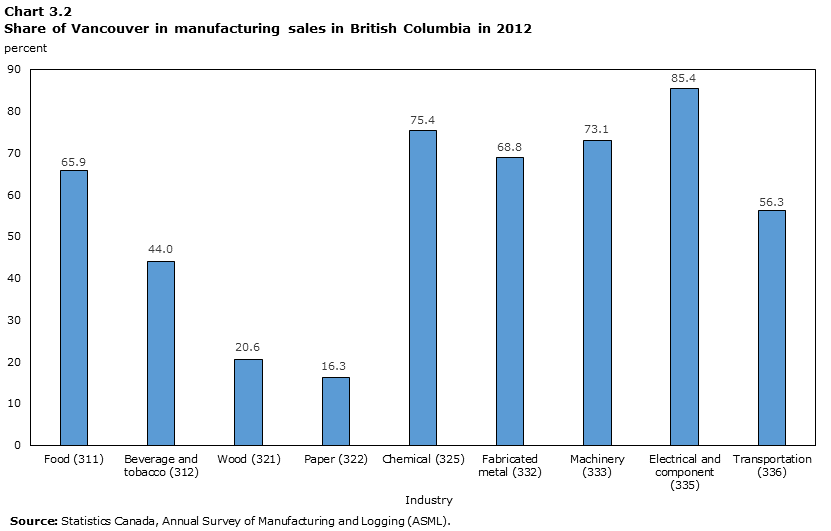
Data table for Graph 3.2
| Industry | Percent |
|---|---|
| Food (311) | 65.9 |
| Beverage and tobacco (312) | 44.0 |
| Wood (321) | 20.6 |
| Paper (322) | 16.3 |
| Chemical (325) | 75.4 |
| Fabricated metal (332) | 68.8 |
| Machinery (333) | 73.1 |
| Electrical and component (335) | 85.4 |
| Transportation (336) | 56.3 |
| Source: Statistics Canada, Annual Survey of Manufacturing and Logging (ASML). | |
Vancouver’s share of provincial sales at the industry level increased slightly from 49.8% in 2007 to 51.5% in 2012 (Table 6.2.1). Manufacturing sales in the wood industry outside of Vancouver declined between 2008 and 2009 and had not fully recovered by 2012. The trend of sales in the paper industry is observable, however individual data point cannot be shown due to the confidentiality of some years (Table 6.2.1). The food industry in B.C., except in Vancouver, has experienced an increasing trend during 2007-2012 period.
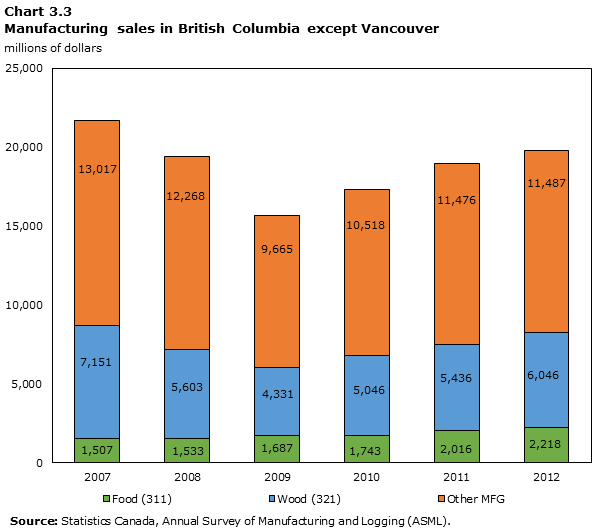
Data table for Graph 3.3
| Industry | 2007 | 2008 | 2009 | 2010 | 2011 | 2012 |
|---|---|---|---|---|---|---|
| millions of dollars | ||||||
| Food (311) | 1,507 | 1,533 | 1,687 | 1,743 | 2,016 | 2,218 |
| Wood (321) | 7,151 | 5,603 | 4,331 | 5,046 | 5,436 | 6,046 |
| Other MFG | 13,017 | 12,268 | 9,665 | 10,518 | 11,476 | 11,487 |
| Source: Statistics Canada, Annual Survey of Manufacturing and Logging (ASML). | ||||||
The Vancouver CMA manufacturing sector is less reliant on the wood and paper industries relative to the rest of the province. But these are still important industries for Vancouver. Food processing is the largest industry in Vancouver and contributed 20.6% to total manufacturing sales in 2012. The food industry was among the few industries to have grown since 2007 (14.5% between 2007 and 2012). The remaining portion of the CMA’s manufacturing is accounted for by wood, fabricated metals, machinery, chemicals, computers and electronics and transportation. The wood industry experienced the largest drop in sales (-24.9%), followed by non-metallic minerals (-22.9%) and fabricated metals (-21.6%).
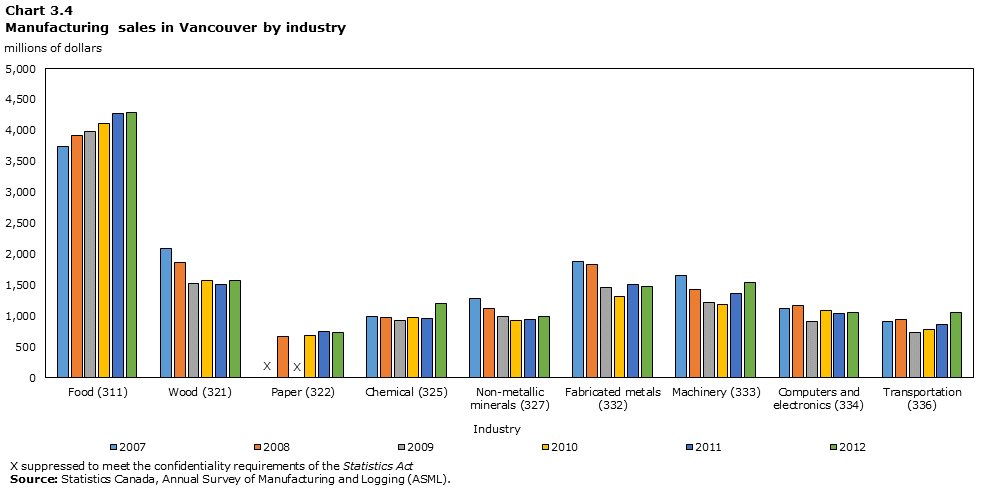
Data table for Graph 3.4
| Industry | 2007 | 2008 | 2009 | 2010 | 2011 | 2012 |
|---|---|---|---|---|---|---|
| millions of dollars | ||||||
| Food (311) | 3,744 | 3,920 | 3,986 | 4,110 | 4,265 | 4,287 |
| Wood (321) | 2,084 | 1,861 | 1,520 | 1,577 | 1,505 | 1,566 |
| Paper (322) | X | 668 | X | 685 | 740 | 723 |
| Chemical (325) | 984 | 979 | 931 | 965 | 956 | 1,206 |
| Non-metallic minerals (327) | 1,277 | 1,115 | 994 | 918 | 939 | 985 |
| Fabricated metals (332) | 1,883 | 1,825 | 1,464 | 1,314 | 1,500 | 1,477 |
| Machinery (333) | 1,658 | 1,428 | 1,207 | 1,183 | 1,359 | 1,545 |
| Computers and electronics (334) | 1,121 | 1,165 | 911 | 1,083 | 1,034 | 1,051 |
| Transportation (336) | 914 | 933 | 732 | 782 | 854 | 1,059 |
|
X suppressed to meet the confidentiality requirements of the Statistics Act Source: Statistics Canada, Annual Survey of Manufacturing and Logging (ASML). |
||||||
Compared with sales, the share of employment by industry out of total manufacturing employment was stable for many industries except food. The share of Vancouver’s food manufacturing employment in B.C. increased from 16.4% in 2007 to 20.0% in 2009 and remained almost flat until 2012. In other industries, the proportions were relatively unchanged.
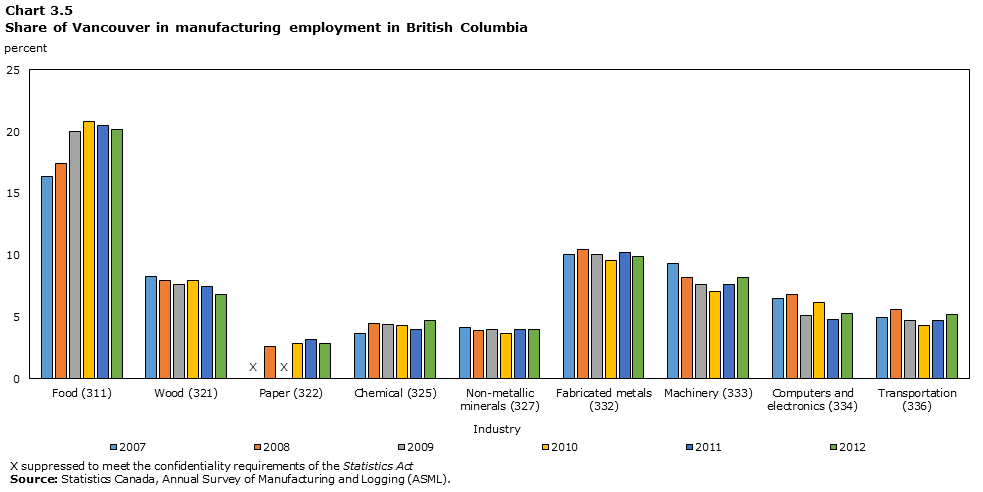
Data table for Graph 3.5
| Industry | 2007 | 2008 | 2009 | 2010 | 2011 | 2012 |
|---|---|---|---|---|---|---|
| percent | ||||||
| Food (311) | 16.4 | 17.4 | 20.0 | 20.8 | 20.5 | 20.2 |
| Wood (321) | 8.3 | 8.0 | 7.6 | 8.0 | 7.5 | 6.8 |
| Paper (322) | X | 2.6 | X | 2.9 | 3.2 | 2.9 |
| Chemical (325) | 3.7 | 4.5 | 4.4 | 4.3 | 4.0 | 4.7 |
| Non-metallic minerals (327) | 4.2 | 3.9 | 4.0 | 3.7 | 4.0 | 4.0 |
| Fabricated metals (332) | 10.1 | 10.5 | 10.1 | 9.6 | 10.2 | 9.9 |
| Machinery (333) | 9.3 | 8.2 | 7.6 | 7.1 | 7.6 | 8.2 |
| Computers and electronics (334) | 6.5 | 6.8 | 5.1 | 6.2 | 4.8 | 5.3 |
| Transportation (336) | 5.0 | 5.6 | 4.7 | 4.3 | 4.7 | 5.2 |
|
X suppressed to meet the confidentiality requirements of the Statistics Act Source: Statistics Canada, Annual Survey of Manufacturing and Logging (ASML). |
||||||
3.2 Alberta, Calgary, and Edmonton
Alberta is characterized by its large oil and gas operations. In 2012, the share of Alberta’s manufacturing GDP in total manufacturing GDP for Canada was 13.0%. In 2012, Alberta also contributed 17.8% to national GDP for all economic sectors.
During the 2008-2009 recession, Alberta diverged from the rest of Canada, in terms of manufacturing sales. The timing of the downturn was different in the province, occurring in 2009 rather than in 2008. By 2012, sales in the province had overtaken their pre-downturn peak, while national sales had not.
Local data provide evidence that manufacturing sales grew differently in Calgary and Edmonton between 2007 and 2012. In particular, Edmonton had a stronger recovery than the rest of the province after the recession. The stronger recovery in Edmonton was attributable to sales growth in the petroleum refining industry as prices of petroleum products recovered, as well as higher sales in industries that support oil and gas extraction sector.
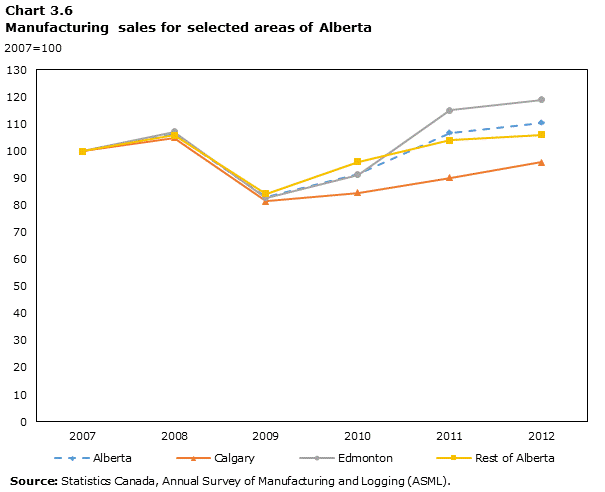
Data table for Graph 3.6
| City | 2007 | 2008 | 2009 | 2010 | 2011 | 2012 |
|---|---|---|---|---|---|---|
| 2007=100 | ||||||
| Alberta | 100.0 | 106.4 | 83.0 | 91.4 | 106.7 | 110.4 |
| Calgary | 100.0 | 105.0 | 81.5 | 84.5 | 90.2 | 95.8 |
| Edmonton | 100.0 | 107.2 | 82.8 | 91.3 | 115.1 | 119.0 |
| Rest of Alberta | 100.0 | 105.9 | 84.3 | 96.0 | 104.0 | 106.0 |
| Source: Statistics Canada, Annual Survey of Manufacturing and Logging (ASML). | ||||||
More than two-thirds of total manufacturing sales in the province are reported by firms located in the Edmonton and Calgary CMAs. This proportion has hardly changed over the six-year period. On average, Edmonton contributed 50.4% to the total manufacturing sales in Alberta between 2007 and 2012.
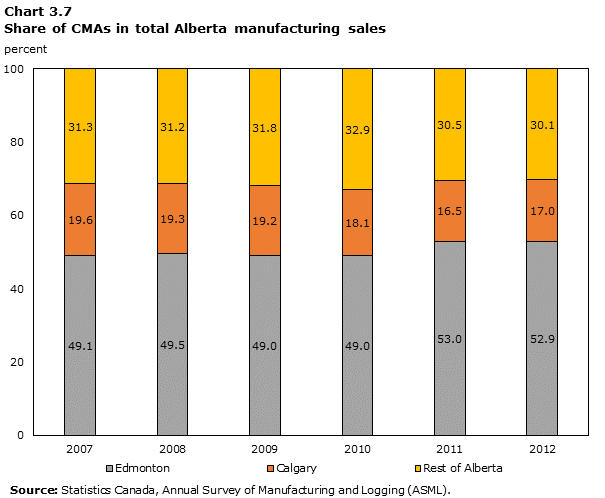
Data table for Graph 3.7
| City | 2007 | 2008 | 2009 | 2010 | 2011 | 2012 |
|---|---|---|---|---|---|---|
| percent | ||||||
| Calgary | 19.6 | 19.3 | 19.2 | 18.1 | 16.5 | 17.0 |
| Edmonton | 49.1 | 49.5 | 49.0 | 49.0 | 53.0 | 52.9 |
| Rest of Alberta | 31.3 | 31.2 | 31.8 | 32.9 | 30.5 | 30.1 |
| Source: Statistics Canada, Annual Survey of Manufacturing and Logging (ASML). | ||||||
Employment in the manufacturing sector in Alberta is distributed differently than sales. Calgary has a higher share of employment compared with its share of sales. Yet, its employment share is less than Edmonton’s. Manufacturing employment fell in Calgary between 2007 and 2012 from 50.9 thousand jobs to 43.4 thousand jobs. However, Edmonton and the rest of the province experienced an increase in the number of manufacturing workers over the same period. A shift in industrial composition or industry input intensity could be responsible for the change in manufacturing employment across CMAs in Alberta between 2007 and 2012.
The oil and gas extraction sector helps to explain differences in proportion and distribution of manufacturing sales and employment across CMAs in Alberta. Petroleum and coal product manufacturing is Edmonton’s largest manufacturing industry and generated $17.7 billion dollars of sales in 2012 (about 46.7% of total manufacturing sales in Edmonton CMA). Yet, because the petroleum industry is highly capital-intensive, it accounts for 2.6% of the CMA’s total manufacturing employment. Differences between sales and employment levels are also seen in other manufacturing industries related to oil and gas extraction. The fabricated metals industry in Edmonton contributed 8.7% ($3.3 billion) to total manufacturing sales in this CMA in 2012 (total manufacturing sales in Edmonton were $38.0 billion in 2012). The fabricated metals industry in Edmonton employed 15.1 thousands workers or 25.5% of total manufacturing employment in the CMA.Note 7
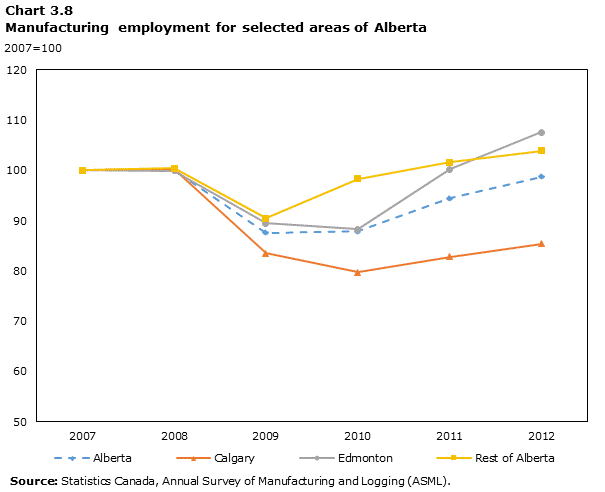
Data table for Graph 3.8
| City | 2007 | 2008 | 2009 | 2010 | 2011 | 2012 |
|---|---|---|---|---|---|---|
| 2007=100 | ||||||
| Alberta | 100.0 | 100.2 | 87.6 | 87.9 | 94.4 | 98.7 |
| Calgary | 100.0 | 100.3 | 83.5 | 79.7 | 82.8 | 85.4 |
| Edmonton | 100.0 | 99.9 | 89.5 | 88.3 | 100.3 | 107.6 |
| Rest of Alberta | 100.0 | 100.4 | 90.5 | 98.3 | 101.6 | 103.9 |
| Source: Statistics Canada, Annual Survey of Manufacturing and Logging (ASML). | ||||||

Data table for Graph 3.9
| Industry | Edmonton | Calgary | Rest of Alberta |
|---|---|---|---|
| percent | |||
| Petroleum and coal (324) | 46.7 | X | X |
| Fabricated metals (332) | 8.7 | 13.6 | 5.4 |
| Machinery (333) | 11.5 | 22.8 | 4.4 |
| Mining, gas, oil field extraction (33313) | 8.1 | 11.8 | 1.9 |
|
X suppressed to meet the confidentiality requirements of the Statistics Act Source: Statistics Canada, Annual Survey of Manufacturing and Logging (ASML). |
|||
In 2012, manufacturing sales of mining, gas, and oil field extraction machinery were $3.1 billion or 8.1% of total manufacturing sales in Edmonton (Table 6.2.7). In Calgary, they accounted for $1.4 billion or 11.8% of total manufacturing sales. The mining, gas, and oil field extraction sub-industry (33313) supplies drills, derricks, and other extraction equipment to the oil extraction industry (it also includes machinery for mineral mining and gas extraction). Hence, Edmonton’s manufacturing sector as a whole simultaneously assists the primary extraction of oil and performs the secondary transformation of oil into a refined product.
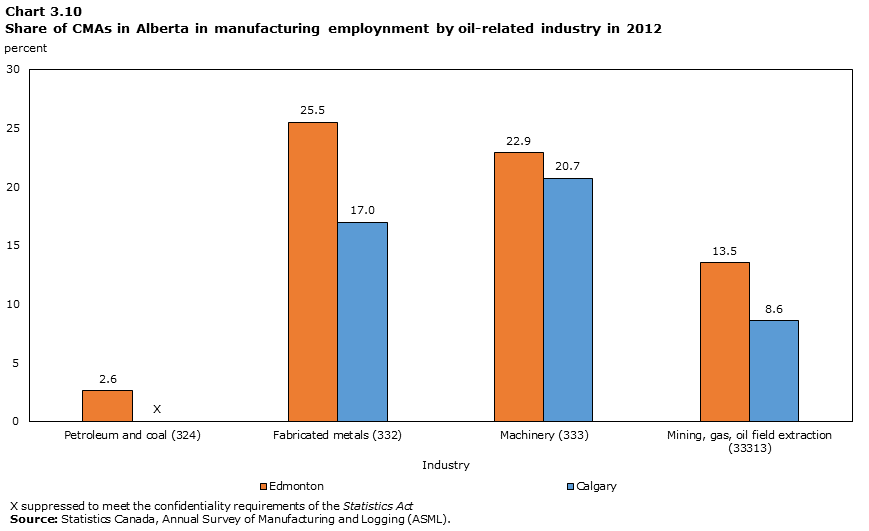
Data table for Graph 3.10
| Industry | Edmonton | Calgary |
|---|---|---|
| percent | ||
| Petroleum and coal (324) | 2.6 | X |
| Fabricated metals (332) | 25.5 | 17.0 |
| Machinery (333) | 22.9 | 20.7 |
| Mining, gas, oil field extraction (33313) | 13.5 | 8.6 |
|
X suppressed to meet the confidentiality requirements of the Statistics Act Source: Statistics Canada, Annual Survey of Manufacturing and Logging (ASML). |
||
The size of manufacturing sector in Calgary is smaller than Edmonton, because there are no large refineries in this CMA. Calgary’s main manufacturing industries (measured by sales) are machinery manufacturing (22.8% in 2012), fabricated metals (13.6% in 2012), and food (11.2% in 2012). The rest of the CMA’s manufacturing sales are distributed somewhat uniformly among smaller industries.
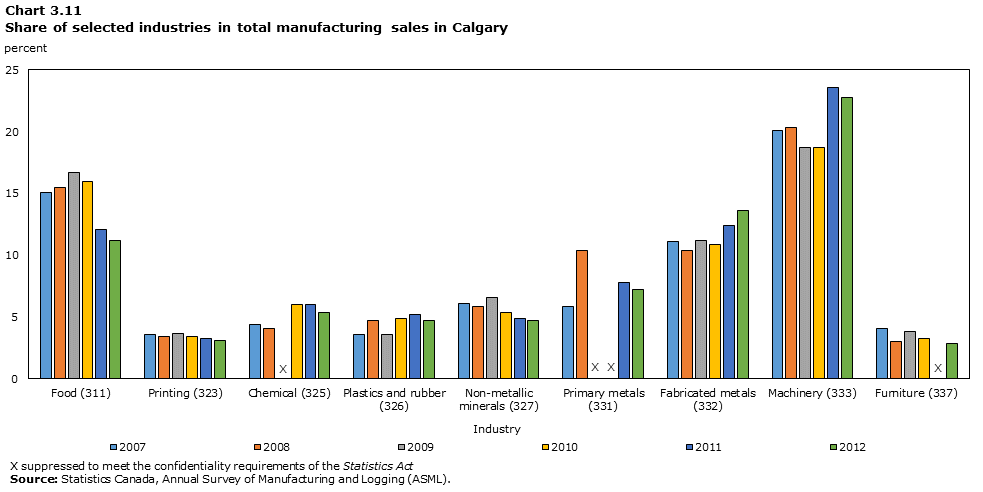
Data table for Graph 3.11
| Industry | 2007 | 2008 | 2009 | 2010 | 2011 | 2012 |
|---|---|---|---|---|---|---|
| percent | ||||||
| Food (311) | 15.1 | 15.5 | 16.7 | 16.0 | 12.1 | 11.2 |
| Wood (321) | 3.6 | 3.4 | 3.7 | 3.4 | 3.3 | 3.1 |
| Paper (322) | 4.4 | 4.1 | X | 6.0 | 6.0 | 5.4 |
| Chemical (325) | 3.6 | 4.7 | 3.6 | 4.9 | 5.2 | 4.7 |
| Non-metallic minerals (327) | 6.1 | 5.9 | 6.6 | 5.4 | 4.9 | 4.7 |
| Fabricated metals (332) | 5.9 | 10.4 | X | X | 7.8 | 7.2 |
| Machinery (333) | 11.1 | 10.4 | 11.2 | 10.9 | 12.4 | 13.6 |
| Computers and electronics (334) | 20.1 | 20.3 | 18.7 | 18.7 | 23.6 | 22.8 |
| Transportation (336) | 4.1 | 3.0 | 3.8 | 3.3 | X | 2.9 |
|
X suppressed to meet the confidentiality requirements of the Statistics Act Source: Statistics Canada, Annual Survey of Manufacturing and Logging (ASML). |
||||||
Manufacturing sectors in Calgary experienced different sales growth rates between 2007 and 2012. Sales in other publishable manufacturing industries increased during the same period, but for food, non-metallic minerals, and printing industries posted lower sales from 2007 to 2012.
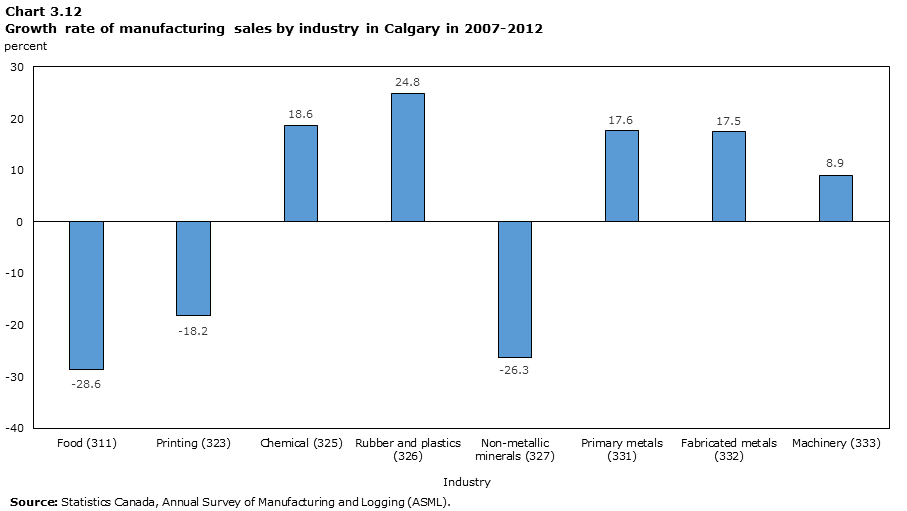
Data table for Graph 3.12
| Industry | Percent |
|---|---|
| Food (311) | -28.6 |
| Printing (323) | -18.2 |
| Chemical (325) | 18.6 |
| Rubber and plastics (326) | 24.8 |
| Non-metallic minerals (327) | -26.3 |
| Primary metals (331) | 17.6 |
| Fabricated metals (332) | 17.5 |
| Machinery (333) | 8.9 |
|
Source: Statistics Canada, Annual Survey of Manufacturing and Logging (ASML). |
|
In terms of employment, Edmonton showed a stronger recovery in manufacturing employment than Calgary and the rest of the province. Manufacturing employment decreased in Calgary from 50.9 thousand in 2007 to 43.4 thousand in 2012.

Data table for Graph 3.13
| CMA | 2007 | 2008 | 2009 | 2010 | 2011 | 2012 |
|---|---|---|---|---|---|---|
| thousands persons | ||||||
| Calgary | 50.9 | 51.0 | 42.5 | 40.5 | 42.1 | 43.4 |
| Edmonton | 55.0 | 54.9 | 49.2 | 48.6 | 55.2 | 59.2 |
| Rest of Alberta | 37.3 | 37.4 | 33.7 | 36.7 | 37.9 | 38.8 |
| Source: Statistics Canada, Annual Survey of Manufacturing and Logging (ASML). | ||||||
3.3 Manitoba and Saskatchewan
Manitoba is the easternmost Prairie province, with 13.6% of Canada’s population. Real estate and rental and leasing, and manufacturing were the largest industries in Manitoba in 2012. Manitoba was responsible for 3.4% of manufacturing GDP in Canada and contributed 3.3% to the total Canadian GDP for all economic sectors in 2012.
For confidentiality reasons, local manufacturing data are not publishable for many industries in Manitoba. However, the publishable data show that manufacturing sectors in the three largest cities in Manitoba and Saskatchewan performed differently during 2007-2012 when compared with each other.
Manufacturing sales in Winnipeg followed the same trend as the total manufacturing sales in Manitoba, staying relatively flat between 2007 and 2010, before rising significantly in 2011 and 2012.
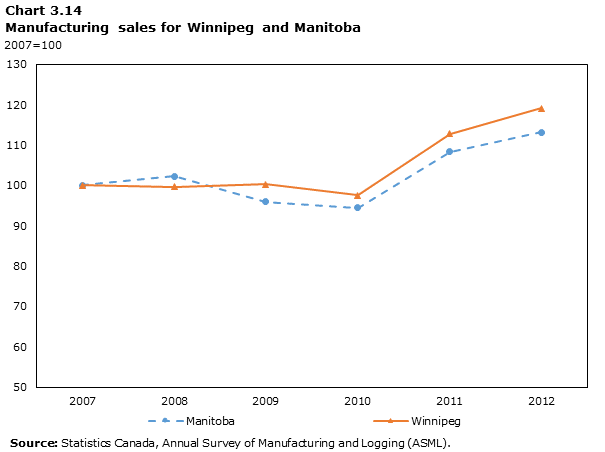
Data table for Graph 3.14
| City | 2007 | 2008 | 2009 | 2010 | 2011 | 2012 |
|---|---|---|---|---|---|---|
| 2007=100 | ||||||
| Manitoba | 100.0 | 102.3 | 96.0 | 94.5 | 108.3 | 113.2 |
| Winnipeg | 100.0 | 99.7 | 100.3 | 97.6 | 112.8 | 119.1 |
| Source: Statistics Canada, Annual Survey of Manufacturing and Logging (ASML). | ||||||
Transportation equipment is the largest manufacturing sector in Winnipeg followed by the food industry. Sales in the CMA of Winnipeg fell, but remained an important core of the CMA’s manufacturing sector. The share of Winnipeg’s transportation equipment industry in total Winnipeg manufacturing sales decreased from 24.3% in 2007 to 19.3% in 2012. During the same period, the share of food in total manufacturing sales fell from 17.1% in 2007 to 15.9% in 2012.
Some manufacturing growth between 2007 and 2012 in Winnipeg came from the industrial machinery sub-industry (3331), which is a part of the machinery industry. In particular, sales in the machinery industry increased by 88% from $690 million in 2007 to $1.3 billion in 2012, largely on the strength of the industrial machinery sub-industry.
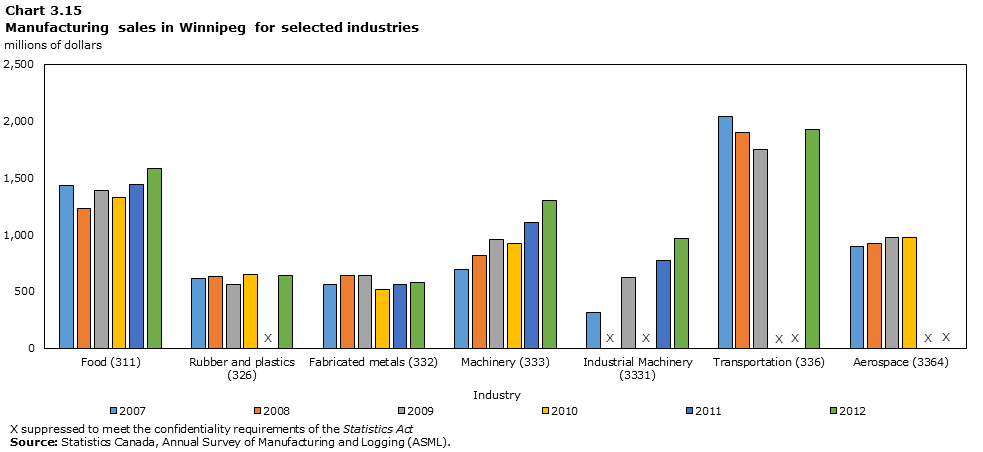
Data table for Graph 3.15
| Industry | 2007 | 2008 | 2009 | 2010 | 2011 | 2012 |
|---|---|---|---|---|---|---|
| millions of dollars | ||||||
| Food (311) | 1,434 | 1,229 | 1,388 | 1,325 | 1,440 | 1,582 |
| Rubber and plastics (326) | 614 | 627 | 560 | 651 | X | 640 |
| Fabricated metals (332) | 563 | 640 | 639 | 513 | 563 | 577 |
| Machinery (333) | 690 | 813 | 954 | 918 | 1,110 | 1,299 |
| Industrial Machinery (3331) | 312 | X | 625 | X | 769 | 965 |
| Transportation (336) | 2,039 | 1,895 | 1,745 | X | X | 1,928 |
| Aerospace (3364) | 897 | 918 | 973 | 975 | X | X |
|
X suppressed to meet the confidentiality requirements of the Statistics Act Source: Statistics Canada, Annual Survey of Manufacturing and Logging (ASML). |
||||||
Saskatchewan is home to 3.2% of the Canadian population. The largest economic sectors in Saskatchewan in 2012 were mining, quarrying, oil and gas extraction, and construction. In 2012, manufacturing was the fifth-largest sector in Saskatchewan. Saskatchewan’s manufacturing sector contributed 2.6% to the total manufacturing GDP of Canada and had strong growth in 2008, 2011 and 2012, while it experienced a very sharp decline in 2009. Manufacturing sales in Regina followed the same trend as total manufacturing sales in the province, except in 2008 where the sales growth rate in Regina was higher than in Saskatchewan. Saskatoon in contrast showed a divergence from the provincial trend in 2008 and 2009, with sales increasing slightly each year.

Data table for Graph 3.16
| City | 2007 | 2008 | 2009 | 2010 | 2011 | 2012 |
|---|---|---|---|---|---|---|
| 2007=100 | ||||||
| Saskatchewan | 100.0 | 119.6 | 108.6 | 107.5 | 119.8 | 133.2 |
| Regina | 100.0 | 136.3 | 115.1 | 111.6 | 121.0 | 129.8 |
| Saskatoon | 100.0 | 103.4 | 105.2 | 104.7 | 115.6 | 129.9 |
| Source: Statistics Canada, Annual Survey of Manufacturing and Logging (ASML). | ||||||
In Regina, manufacturing sales rose from $5.0 billion in 2007 to $6.5 billion in 2012. As illustrated in the chart below, just under half of all manufacturing sales in Saskatchewan are concentrated in Regina. The CMA’s share of the province’s total manufacturing sales was on a constant, although slow decline from 2008 to 2012. Meanwhile, Saskatoon’s manufacturing sales went up from $3.1 billion in 2007 to $4.1 billion in 2012. However, the share of Saskatoon in total manufacturing sales of the province remained unchanged for most years (except 2008) at about 27.0%.

Data table for Graph 3.17
| City | 2007 | 2008 | 2009 | 2010 | 2011 | 2012 |
|---|---|---|---|---|---|---|
| percent | ||||||
| Regina | 45.1 | 51.4 | 47.8 | 46.8 | 45.6 | 44.0 |
| Saskatoon | 28.4 | 24.5 | 27.5 | 27.6 | 27.4 | 27.7 |
| Rest of Saskatchewan | 26.5 | 24.0 | 24.6 | 25.5 | 27.0 | 28.3 |
| Source: Statistics Canada, Annual Survey of Manufacturing and Logging (ASML). | ||||||
3.4 Ontario
Manufacturing was the second-largest economic sector in Ontario in 2012. About 44% of total manufacturing GDP in Canada is produced in Ontario, the highest share of all provinces. The total economy of Ontario contributed 37.4% to Canada’s GDP in 2012.
Total manufacturing sales in Ontario dropped from $289.7 billion in 2007 to $266.4 billion in 2012. At the same time, Toronto’s share of Ontario’s manufacturing sales slightly increased from 36.5% in 2007 to 36.9% in 2012. Still, the majority (56.3% in 2007 and 2012) of manufacturing activities in Ontario occur outside of Toronto, Ottawa-Gatineau and Hamilton Toronto’s industries are diverse, while other Ontario CMAs are home to fewer industries. As can be seen in the graph below, the trends of manufacturing sales in Ontario’s three largest selected CMAs sometimes diverge from the provincial trend. Such is the case of Ottawa-Gatineau’s slight increase in 2009 and sharp decrease in 2012Note 8. Hamilton, in turn, had a sharp dip in sales in 2008 and a more pronounced recovery after 2009.

Data table for Graph 3.18
| City | 2007 | 2008 | 2009 | 2010 | 2011 | 2012 |
|---|---|---|---|---|---|---|
| 2007=100 | ||||||
| Ontario | 100.0 | 92.7 | 76.8 | 82.9 | 87.9 | 91.9 |
| Ottawa - Gatineau | 100.0 | 90.6 | 89.3 | 85.5 | 87.7 | 72.2 |
| Toronto | 100.0 | 90.7 | 80.6 | 82.9 | 86.5 | 93.0 |
| Hamilton | 100.0 | 105.9 | 80.0 | 88.3 | 95.0 | 94.1 |
| Source: Statistics Canada, Annual Survey of Manufacturing and Logging (ASML). | ||||||
However, total manufacturing sales in the province are highly influenced by manufacturing activities in Toronto. Toronto’s manufacturing sector is the largest of all CMAs in Canada, and quite diverse. The largest manufacturing industry in Toronto, by far, is the transportation equipment industry, part of which is composed of automotive industry, automobile parts and aerospace products manufacturing. The food manufacturing is the second largest industry in Toronto and play a significant role in its manufacturing sector. Toronto also produces chemicals, fabricated metals, and rubber and plastics.

Data table for Graph 3.19
| Industry | 2007 | 2012 |
|---|---|---|
| millions of dollars | ||
| Food (311) |
11,923 | 14,509 |
| Beverage (312) |
2,759 | 2,855 |
| Paper (322) |
3,065 | 2,762 |
| Printing (323) |
3,592 | 2,783 |
| Chemicals (325) |
8,227 | 9,079 |
| Rubber (326) |
7,598 | 5,696 |
| Non- metallic (327) |
2,221 | 2,280 |
| Primary metals (331) |
2,523 | 1,847 |
| Fabricated metals (332) |
8,800 | 6,491 |
| Machinery (333) |
5,480 | 5,665 |
| Electrical (335) |
2,042 | 1,787 |
| Transportation (336) |
31,614 | 29,687 |
| Auto parts (3363) |
8,024 | 7,004 |
| Aerospace (3364) |
3,793 | 3,533 |
| Furniture (337) |
4,516 | 3,546 |
| Source: Statistics Canada, Annual Survey of Manufacturing and Logging (ASML). | ||
A few manufacturing industries in Toronto grew between 2007 and 2012. Sales in the food industry increased from $11.9 billion in 2007 to $14.5 billion in 2012, an absolute growth rate of 21.7% during the 2007-2012 period. In 2012, the chemical industry was the third-largest manufacturing sector of Toronto, with growth coming from the pharmaceutical (3254) and basic chemical sub-industries (3251). Sales of chemical products in Toronto rose 10.4% between 2007 and 2012.
Although sales in the transportation equipment manufacturing industry declined from $31.6 billion in 2007 to $29.7 billion in 2012, the share of transportation equipment industry in total manufacturing sales in Toronto actually increased from 29.9% in 2007 to 30.2% in 2012. Despite the small decrease in total sales in transportation equipment in Toronto between 2007 and 2012, the relative share of the aerospace industry and auto parts in Toronto’s total manufacturing sales of transportation equipment remained steady.

Data table for Graph 3.20
| Industry | 2007 | 2012 |
|---|---|---|
| millions of dollars | ||
| Auto parts (3363) | 8,024 | 7,004 |
| Aerospace (3364) | 3,793 | 3,533 |
| Rest of industry | 19,797 | 19,150 |
| Source: Statistics Canada, Annual Survey of Manufacturing and Logging (ASML). | ||
In Toronto, the food manufacturing industry is the second largest industry in terms of sales. The main components include rendering and meat processing (311614), sugar and confectionery products (3113), and bread and bakery products (31181), and other food manufacturing activities (3119).

Data table for Graph 3.21
| Industry | millions of dollars |
|---|---|
| Animal food (3111) |
394 |
| Grain and oilseed (3112) |
835 |
| Sugar and confectionery (3113) |
1,782 |
| Frozen food (31141) |
284 |
| Fruit canning, picking, drying (31142) |
852 |
| Fluid milk (311511) |
1,124 |
| Butter, cheese, dry (311515) |
255 |
| Ice cream and frozen dessert (311520) |
24 |
| Animal except poultry (311611) |
382 |
| Rendering and meat processing (311614) |
1,876 |
| Poultry (311615) |
1,553 |
| Seafood (3117) |
210 |
| Bread and bakery products (31181) |
1,680 |
| Cookie, cracker and pasta (31182) |
1,166 |
| Other food (3119) |
2,093 |
| Source: Statistics Canada, Estimates of population by census metropolitan area, CANSIM (database). | |
Ottawa-Gatineau
In Ottawa-GatineauNote 9, the size of the computer and electronics industry fell 67.8% between 2007 and 2012. This decline was a major contributor to the overall decrease in the CMA’s manufacturing sales shown on Graph 3.22.
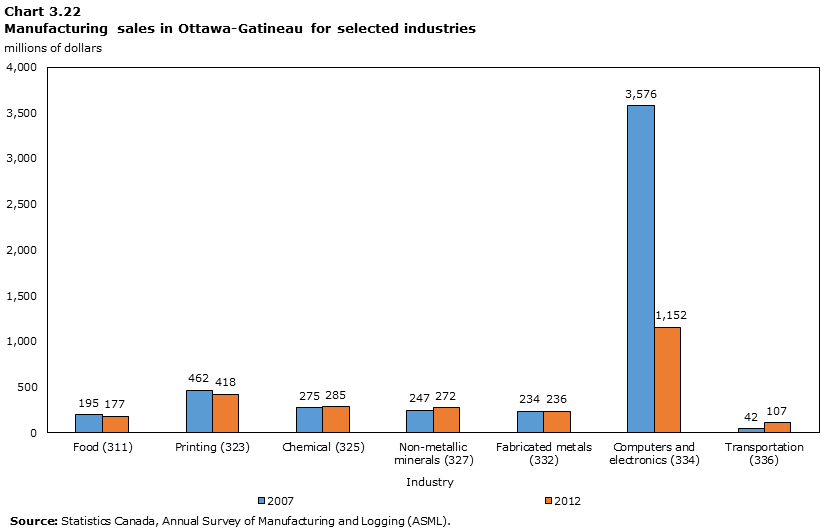
Data table for Graph 3.22
| Industry | 2007 | 2012 |
|---|---|---|
| millions of dollars | ||
| Food (311) | 195 | 177 |
| Printing (323) | 462 | 418 |
| Chemical (325) | 275 | 285 |
| Non-metallic minerals (327) | 247 | 272 |
| Fabricated metals (332) | 234 | 236 |
| Computers and electronics (334) | 3,576 | 1,152 |
| Transportation (336) | 42 | 107 |
| Source: Statistics Canada, Annual Survey of Manufacturing and Logging (ASML). | ||
The significant drop in the share of computer and electronic industry in Ottawa-Gatineau area came from lower sales in the communications equipment industry and lower sales of computer and peripheral products.
Although still small when compared with the other industries in Ottawa-Gatineau, the transportation industry’s sales almost tripled in the 2007-2012 period.

Data table for Graph 3.23
| Industry | 2007 | 2012 |
|---|---|---|
| millions of dollars | ||
| Computer and peripheral (3341) | 640 | 163 |
| Navigational, measuring (3345) | 761 | 570 |
| Rest of industry | 2,175 | 1,152 |
| Source: Statistics Canada, Annual Survey of Manufacturing and Logging (ASML). | ||
Hamilton
In Hamilton, the primary metal industry is the largest manufacturing industry. Most of the manufacturing activity in the CMA is comprised of metal industries, food, machinery, and transportation. Between 2007 and 2009, manufacturing sales in primary metals, fabricated metals, and transportation equipment industries all declined sharply. Between 2009 and 2012, in turn, primary metals and transportation recovered, but fabricated metals did not, increasing just 4.4% over that time.

Data table for Graph 3.24
| Industry | 2007 | 2009 | 2012 |
|---|---|---|---|
| millions of dollars | |||
| Food (311) | 2,077 | 2,174 | 2,118 |
| Primary metal (331) | 5,189 | 3,665 | 5,044 |
| Fabricated metal (332) | 1,610 | 976 | 1,019 |
| Machinery (333) | 1,308 | 1,360 | 1,177 |
| Transportation (336) | 1,167 | 635 | 1,323 |
| Source: Statistics Canada, Annual Survey of Manufacturing and Logging (ASML). | |||
Shares of manufacturing sales among Ontario’s CMAs were very stable over 2007 to 2012. When the shares for sales are compared with those of employment, Toronto is shown to have a larger share of manufacturing jobs than it has a share of manufacturing sales. The shares of both sales and jobs declined in Ottawa-Gatineau, while those of the other CMAs have remained stable.

Data table for Graph 3.25
| City | 2007 | 2008 | 2009 | 2010 | 2011 | 2012 | ||||||
|---|---|---|---|---|---|---|---|---|---|---|---|---|
| Employment | Sales | Employment | Sales | Employment | Sales | Employment | Sales | Employment | Sales | Employment | Sales | |
| percent | ||||||||||||
| Toronto | 46.2 | 36.5 | 46.5 | 35.7 | 47.6 | 38.3 | 47.3 | 36.5 | 46.8 | 35.9 | 46.6 | 36.9 |
| Hamilton | 5.6 | 5.0 | 5.8 | 5.7 | 5.9 | 5.2 | 6.0 | 5.3 | 6.0 | 5.4 | 5.7 | 5.1 |
| Ottawa - Gatineau | 3.3 | 2.2 | 2.8 | 2.1 | 2.8 | 2.5 | 2.7 | 2.2 | 2.9 | 2.2 | 2.5 | 1.7 |
| Source: Statistics Canada, Annual Survey of Manufacturing and Logging (ASML). | ||||||||||||
3.5 Quebec
Manufacturing is the largest economic sector in Quebec. In 2012, the Quebec manufacturing sector contributed 24.9% towards total Canadian manufacturing GDP. The distribution of manufacturing sales in Quebec changed slightly during the 2007-2012 period. Manufacturing sales in the Montréal and Québec CMAs, as well as those in the rest of the province declined between 2007 and 2009. Yet during the recovery from 2009 to 2012, sales in the Québec CMA recovered more strongly and surpassed their 2007 level by 2010. Sales in the rest of the province decreased from $61.8 billion to $52.9 billion and then increased to $59.5 billion in 2012. Sales in Montréal, however, recovered the least, and were still well-below pre-recession levels at $62.4 billion.
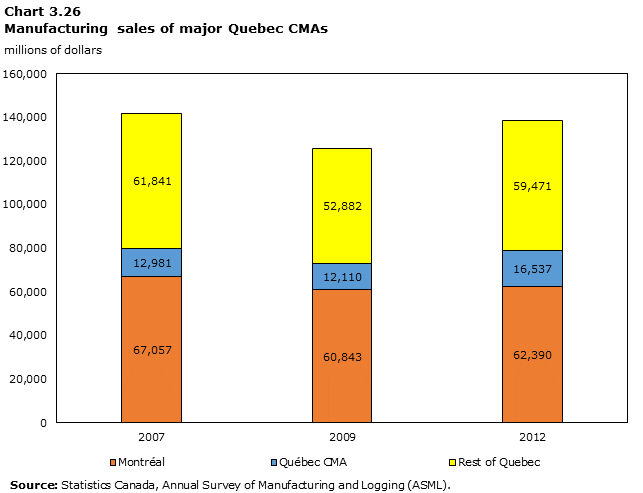
Data table for Graph 3.26
| Industry | 2007 | 2009 | 2012 |
|---|---|---|---|
| millions of dollars | |||
| Québec CMA | 12,981 | 12,110 | 16,537 |
| Montréal | 67,057 | 60,843 | 62,390 |
| Rest of Quebec | 61,841 | 52,882 | 59,471 |
| Source: Statistics Canada, Annual Survey of Manufacturing and Logging (ASML). | |||
Montréal
Transportation equipment industry (336) is the largest manufacturing sector in Montréal with over $10 billion sales in 2012 (Table 6.2.20). The aerospace industry (3364) is the largest sub-industry of transportation equipment industry in Montréal. Sales of aerospace products contributed 13.9% to total manufacturing sales in Montréal between 2007 and 2012. The contribution of the aerospace sub-industry to total sales in transportation equipment in Montréal was 84.6% in 2007 and 83.8% in 2012.
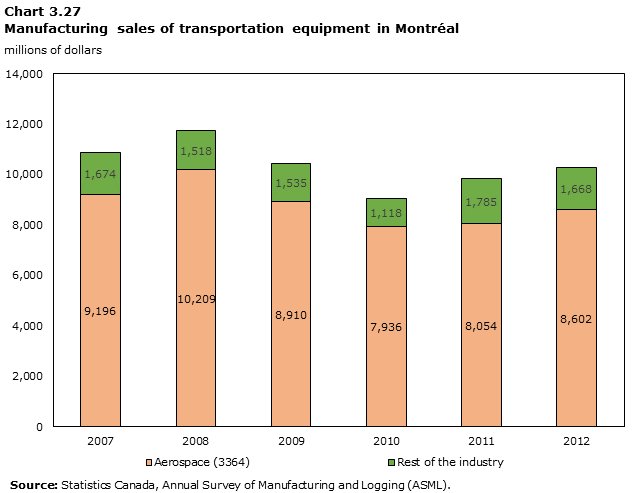
Data table for Graph 3.27
| Industry | 2007 | 2008 | 2009 | 2010 | 2011 | 2012 |
|---|---|---|---|---|---|---|
| millions of dollars | ||||||
| Aerospace (3364) | 9,196 | 10,209 | 8,910 | 7,936 | 8,054 | 8,602 |
| Other transportation equipment | 1,674 | 1,518 | 1,535 | 1,118 | 1,785 | 1,668 |
| Source: Statistics Canada, Annual Survey of Manufacturing and Logging (ASML). | ||||||
As Table 6.2.20 shows, the chemical industry in 2007 and food industry in 2012 were the second and third-largest manufacturing industries in Montréal after the transportation equipment industry. The chemical industry in Montréal is mainly composed of basic chemical and pharmaceutical manufacturing. The share of basic chemical products in total chemical industry increased from 31.9% in 2007 to 40.4% in 2012, while the share of pharmaceutical products went up slightly, from 30.9% in 2007 to 31.8% in 2012.
Food manufacturing sales in Montréal increased from $6.2 billion in 2007 to $7.3 billion in 2012, showing 17.4% increase over 2007-2012. However, the share of food industry in total manufacturing sales in Quebec as a whole increased 26.2% during the same period (from 9.2% in 2007 to 11.6% in 2012).

Data table for Graph 3.28
| Industry | 2007 | 2009 | 2012 |
|---|---|---|---|
| millions of dollars | |||
| Basic chemicals (3251) | 31.9 | 27.8 | 40.4 |
| Pharmaceuticals (3254) | 30.9 | 38.9 | 31.8 |
| Other chemical industry | 37.1 | 33.2 | 27.8 |
| Source: Statistics Canada, Annual Survey of Manufacturing and Logging (ASML). | |||
Québec
Québec CMA experienced strong growth after 2009. Total manufacturing sales in this CMA increased from $12.1 billion in 2009 to $16.5 billion in 2012. Strong sales in food manufacturing were partly responsible for the growth in the Québec CMA after 2009.
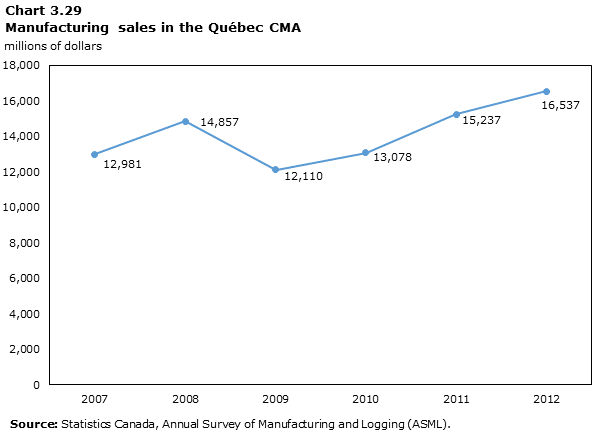
Data table for Graph 3.29
| Industry | 2007 | 2008 | 2009 | 2010 | 2011 | 2012 |
|---|---|---|---|---|---|---|
| millions of dollars | ||||||
| All manufacturing | 12,981 | 14,857 | 12,110 | 13,078 | 15,237 | 16,537 |
| Source: Statistics Canada, Annual Survey of Manufacturing and Logging (ASML). | ||||||
Manufacturing employment in Quebec decreased 9.7% between 2007 and 2012. Montréal, with a 12.0% decrease in manufacturing employment, was largely responsible for the overall drop in total manufacturing employment in the province. The decline was slightly offset by an increase in manufacturing employment in Québec CMA. In this CMA, employment went up from 27.8 thousand in 2007 to 27.9 in 2012.

Data table for Graph 3.30
| City | 2007 | 2009 | 2012 |
|---|---|---|---|
| thousands persons | |||
| Québec CMA | 27.8 | 29.3 | 27.9 |
| Montréal | 220.0 | 196.1 | 193.5 |
| Rest of Quebec | 203.4 | 178.1 | 185.9 |
| Source: Statistics Canada, Annual Survey of Manufacturing and Logging (ASML). | |||
4. Conclusion
Local manufacturing data indicates that manufacturing sales of the Prairie provinces’ CMAs and those of the Québec CMA grew between 2007 and 2012. The refining of petroleum and the manufacturing of fabricated metals and machinery were the key to the growth in sales in Alberta. Manufacturing sales in the other CMAs appeared to decrease between 2007 and 2009, and then returned to 2007 levels.
As a final note, the data in this study should be regarded as experimental in nature. The local data developed here may not follow trends seen in other data sources, such as the Survey of Employment, Payroll and Hours (SEPH). The main reason for considering these data as experimental is because the ASML for reference years 2007 through 2012 was not designed to compile data by CMA. Hence, the methodology used in this study extends the limits of the ASML survey design.
5. References
- Brown, Mark and Rispoli, Luke. 2014. “Metropolitan Gross Domestic Product: Experimental Estimates, 2001 to 2009”; Catalogue no. 11-626-X, www.statcan.gc.ca/pub/11-626-x/11-626-x2014042-eng.htm, Ottawa.
- Beckstead, Desmond; Brown, Mark; Guo, Yusu and Newbold, K. Bruce. 2010. “Cities and Growth: Earnings Levels Across Urban and Rural Areas: The Role of Human Capital”; Catalogue no. 11-622-M; www.statcan.gc.ca/pub/11-622-m/11-622-m2010020-eng.htm, Ottawa.
- GIBBONS, Will and KOWALUK, Russell. 2008. "Manufacturing: The Year 2007 in Review." Analysis in Brief. no. 70. Statistics Canada, Catalogue no. 11-621-M, www.statcan.gc.ca/pub/11-621-m/11-621-m2008070-eng.htm., Ottawa.
- KOWALUK, Russell and LARMOUR, Rob. 2009. "Manufacturing: The Year 2008 in Review." Analysis in Brief. no. 77. Statistics Canada, Catalogue no. 11-621-M, www.statcan.gc.ca/pub/11-621-m/11-621-m2009077-eng.htm., Ottawa.
- HARDING, Gwen and Russell KOWALUK. 2010. "Manufacturing: The Year 2009 in Review" Analysis in Brief. no. 87. Statistics Canada catalogue no. 11-621-M. www.statcan.gc.ca/pub/11-621-m/11-621-m2010087-eng.htm, Ottawa.
- PAUL, Jeff and Norman CROMEY. 2011. "Manufacturing: The Year 2010 in Review" Analysis in Brief. no. 88. Statistics Canada catalogue no. 11-621-M, www.statcan.gc.ca/pub/11-621-m/11-621-m2011088-eng.htm, Ottawa.
- RICHARDS, Elizabeth and Michael SCHIMPF. 2012. "Manufacturing: The Year 2011 in Review" Analysis in Brief. no. 90. Statistics Canada catalogue no. 11-621-M. www.statcan.gc.ca/pub/11-621-m/11-621-m2012090-eng.htm, Ottawa.
- SCHIMPF, Michael. John SEAY and Stephanie VENTRESCA. 2013. "Manufacturing: The Year 2012 in Review" Analysis in Brief. no. 91. Statistics Canada catalogue no. 11-621-M. www.statcan.gc.ca/pub/11-621-m/11-621-m2013091-eng.htm., Ottawa.
6. Appendix: Provincial indicators and tables
Notes
- Date modified: