
Statistics Canada
www.statcan.gc.ca
Common menu bar links
Canadian Direct Investment in ‘Offshore Financial Centers’

Archived Content
Information identified as archived is provided for reference, research or recordkeeping purposes. It is not subject to the Government of Canada Web Standards and has not been altered or updated since it was archived. Please "contact us" to request a format other than those available.
by François Lavoie
Balance of Payments Division
Summary
Assets in Offshore Financial Centers growing rapidly
Offshore Financial Centers attract financial sector investment
Two-thirds of bank direct investment assets in Offshore Financial Centers
Over one-quarter of growth in direct investment assets in Offshore Financial Centers
Summary
From 1990 to 2003, Canadian enterprises invested substantial and growing amounts in countries known as ‘Offshore Financial Centers’ (OFCs), many of them in the Caribbean.
As defined by the International Monetary Fund, ‘Offshore Financial Centers’ include countries that are often referred to as “tax havens”, as well as those with an especially important financial sector, such as Switzerland (What countries are ‘Offshore Financial Centers’?).
Between 1990 and 2003, Canadian assets in OFCs increased eight-fold. As a result, these centres accounted for more than one-fifth of all Canadian direct investment abroad in 2003, double the proportion 13 years earlier.
For simplicity, in this article the term “assets” designates Canadian direct investment positions abroad. The position represents the total value of direct investment assets at the end of the period (Concepts and data sources). Direct investment mainly serves to finance the creation of new enterprises, the acquisition of existing ones and the activities of foreign affiliates.
Among OFCs, the largest growth in Canadian direct investment during this time occurred in Barbados, Ireland, Bermuda, the Cayman Islands and the Bahamas. By 2003, these 5 centres were among the 11 nations with the most Canadian assets.
Meanwhile, the share of Canadian direct investment going to the United States, Canada’s main economic partner, has declined considerably. As a result, in 2000, Canadian enterprises held fewer assets in the United States than in all other countries combined.
Since 1999, the financial sector has accounted for more Canadian assets than any other sector, ahead of processing, services and manufacturing.
This article analyses Canadian direct investment in OFCs between 1990 and 2003. It provides an analysis of the distribution of Canadian direct investment assets in OFCs and elsewhere in the world by industry. Lastly, it measures and analyses these countries’ contribution to the growth of assets held abroad by Canadian enterprises during the period.
What countries are ‘Offshore Financial Centers’?
This study uses the definition and list provided by the International Monetary Fund.1 According to the IMF definition, an OFC is a jurisdiction that meets the following criteria:
- has a large number of financial institutions,
- most transactions are initiated abroad,
- most institutions are controlled by non-residents,
- has assets and liabilities out of proportion to the domestic economy; and
- has low or zero taxation, moderate or light financial regulation and bank secrecy.
The last criterion corresponds to what is generally called a “tax haven.” However, while the definition includes “tax havens,” it is not limited to this type of country. OFCs covered by the definition may vary substantially. For example, Switzerland and the Cayman Islands cannot be considered to be on the same footing with respect to regulation, taxes or the value added resulting from the transactions carried out.
Other limitations have to do with the data available relative to the definition of OFCs. First, the list of jurisdictions considered remains the same for the entire period, regardless of any changes that may have occurred before or after the list was established. Next, it is impossible to distinguish a zone meeting the OFC criteria from the country as a whole, as in the case of Ireland or Malaysia.
In its studies, the International Monetary Fund identifies 42 jurisdictions that have significant offshore activities. Canadian enterprises held assets in 25 of these jurisdictions in 2003.
| Country1 | Canadian
direct investment position (millions of $) |
Rank |
|---|---|---|
| Barbados | 24,690 | 3 |
| Ireland (Dublin) | 18,226 | 4 |
| Bermuda | 10,845 | 6 |
| Cayman Islands | 10,619 | 8 |
| Bahamas | 8,802 | 11 |
| Switzerland | 4,044 | 18 |
| Singapore | 3,735 | 19 |
| Hong Kong | 2 535 | 22 |
| Channel Islands2 | x | x |
| Malaysia (Labuan) | 716 | 32 |
| Luxembourg | 683 | 33 |
| British Virgin Islands | 307 | 45 |
| Panama | 131 | 64 |
| Netherlands Antilles | 107 | 69 |
| Costa Rica | 94 | 74 |
| Cyprus | 92 | 76 |
| Belize | x | x |
| Mauritius | x | x |
| Saint Lucia | x | x |
| Antigua and Barbuda | x | x |
| Malta | x | x |
| Aruba | x | x |
| Seychelles | x | x |
| Bahrain | x | x |
| Macau | x | x |
| x Data are confidential under the Statistics Act. 1. Canadian enterprises had no assets in the following OFCs in 2003: Andorra, Anguilla, Cook Islands, Gibraltar (U.K.), Marshall Islands, Liechtenstein, Lebanon, Monaco, Nauru, Niue, Samoa, Saint Kitts and Nevis, Saint Vincent and the Grenadines, Turks and Caicos Islands, Vanuatu. 2. The IMF distinguishes the jurisdictions of Guernsey, Isle of Man and Jersey. Source: Statistics Canada, CANSIM, Table 376-0051, Balance of Payments Division. |
||
Assets in Offshore Financial Centers growing rapidly
Canadian enterprises have invested substantial and growing amounts in OFCs. Between 1990 and 2003, Canadian assets in these countries went from $11 billion to $88 billion.
The average annual rate of growth of Canadian direct investment in these countries was higher (+18%) than in the United States (+8%) and in other countries2 (+14%). As a result, the share of assets held in OFCs doubled, reaching 22% in 2003, compared to 11% in 1990. Barbados, Ireland, Bermuda, the Cayman Islands and the Bahamas experienced the strongest growth during the period.
In 2003, over a fifth of Canadian direct investment assets were in OFCs.

Source: Balance of Payments Division.
Growth was also strong in the “other countries” category, where the value of assets went from $28 billion to $146 billion, representing more than a third of Canadian assets abroad in 2003. European countries such as the United Kingdom, France, the Netherlands, Hungary and Germany accounted for approximately half of Canadian assets abroad in the “other countries” category. Elsewhere in the world, Japan, Australia, Brazil, Chile and India accounted for a quarter of these assets.
During the same period, the share of direct investment assets located in the United States fell substantially, from 61% to 41%, even though Canadian assets in that country practically tripled. Over the entire history of Canadian direct investment abroad, it is only since 2000 that Canadian enterprises have held fewer assets in the United States than in all other countries combined.
Canadian direct investment abroad is diversifying. Indeed, the share held in the United States and the United Kingdom—Canada’s historical partners—fell from 75% to 51% between 1990 and 2003. New countries have appeared as major destinations of Canadian direct investment, including the Cayman Islands, Hungary, Chile and Argentina.
However, the measure of direct investment does not always reveal the final destination of the investment (see box entitled Concepts and data sources). For example, part of the investment directed toward OFCs, especially those in the Caribbean, is likely to be subsequently reinvested in the United States.
Direct investment abroad is a major vehicle of globalization. It enables enterprises to expand their market and locate their management, production or distribution activities on the basis of comparative advantages. At the same time, such investment constitutes a significant and stable contribution to the economic development of the countries into which it is directed.3
The distribution of direct investment abroad throughout the world depends on various factors related to the host country: political stability, economic weight, population characteristics, natural resources available, access to major markets, etc.4 Under these circumstances, some countries attempt to stand out by attracting foreign investors through tax policy and direct investment incentives, as is done by most OFCs.
Worldwide, direct investment abroad exceeded $10 trillion worth of assets in 2003.5 That same year, Canadian assets totalled nearly $400 billion, putting Canada in tenth place.
Offshore Financial Centers attract financial sector investment
OFCs have a special place in the financial sector. An examination of the distribution of Canadian direct foreign investment assets by the industry6 of the subsidiaries and associated enterprises abroad shows just how large a place OFCs occupy within the financial sector and how that place has expanded since 1990.
Assets held in the financial sector of OFCs have increased practically tenfold, going from $8 billion in 1990 to $72 billion in 2003. Because of this strong growth, these centres’ share of financial assets has gone from 27% to 43%. Furthermore, since 1996, OFCs have been the most popular destination for Canadian foreign direct investment in the financial sector.
OFCs have largest share of financial sector assets.
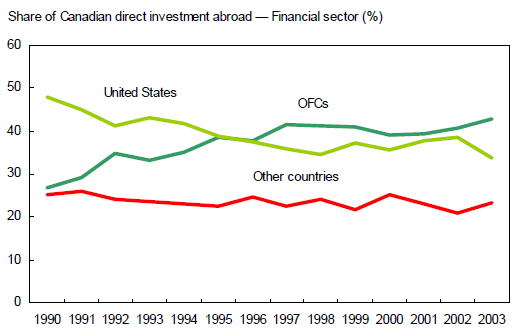
Source: Balance of Payments Division.
One-third of Canadian financial sector assets were in the United States in 2003, representing $57 billion. Thus, that year, for each dollar of Canadian assets in the US financial sector, about $1.25 was held in the financial sector of OFCs. Other countries accounted for approximately one-quarter of Canadian financial sector assets abroad in 2003, similar to the share in 1990.
Overall, financial sector assets abroad sextupled between 1990 and 2003, going from $29 billion to $169 billion. During this period, the financial sector’s share climbed from 29% to 42%, making it the leading sector receiving Canadian direct investment abroad starting in 1999.
Between 1990 and 2003, the share of Canadian assets abroad in the processing sector7 declined (from 40% to 30%) as did the share in the services sector8 (from 23% to 17%). The share held by the manufacturing sector9 was up (from 8% to 11%). That sector peaked in 2000, led by the manufacture of electrical and electronic products.
In 2003, Canadian assets abroad stood at $118 billion in the processing sector, $67 billion in services and $45 billion in manufacturing.
Financial sector assets exceed those in the processing sector.

Source: Balance of Payments Division.
Two-thirds of bank direct investment assets in Offshore Financial Centers
In 2003, OFCs represent practically two-thirds of Canadian assets in the banking sector, corresponding to $53 billion. OFCs were far ahead of the United States and the rest of the world, which had respectively $22 billion and $8 billion in banking assets. The growth of bank assets in OFCs was substantial, since OFCs had accounted for only a third of such assets in 1990.
Whereas OFCs obtained the lion’s share of investment related to investment services10 in the late 1990s, the assets for these services were distributed fairly equally by type of country in 2003, with OFCs accounting for approximately one-third.
Between 1990 and 2003, the share of assets of the insurance sector in OFCs climbed from 8% to 14%. Within this sector, the United States came first in 2003, representing more than half of the assets abroad. Even so, this was down from the two-thirds registered in 1990.
In 2003, banking services abroad accounted for $84 billion in Canadian assets, ranking first among financial services. Banking services ranked ahead of investment ($38 billion), insurance ($31 billion) and other financial services11 ($16 billion).
Investment in other financial services was up, accounting for one-tenth of financial sector assets in 2003 compared to less than 2% in 1990. The United States and other countries contributed to this increase, since the share of these assets in OFCs fell from 47% to 16%.
OFCs have over 60% of banking direct investment assets in 2003.

Source: Balance of Payments Division.
Assets in banking services dominate financial sector.

Source: Balance of Payments Division.
While OFCs are naturally linked to the banking sector by the criteria that identify them, the amount of banking investment in these countries is nonetheless remarkable. By way of comparison, it exceeded the entire manufacturing sector’s share of Canadian assets abroad ($53 billion compared to $45 billion).
Over one-quarter of growth in direct investment assets in Offshore Financial Centers
Between 1990 and 2003, Canadian direct investment assets abroad quadrupled, going from $98 billion to $399 billion. An analysis of the contribution to growth12 by industry, geographic region and type of country shows that more than a quarter of the increase in assets, or $78 billion, went to OFCs.
OFCs in the Americas excluding the United States accounted for 17% of the overall increase in assets, whereas OFCs in Europe accounted for 8% and those in Africa, Asia and Oceania for 2%. This shows the importance of OFCs in the Americas, especially in the case of the financial sector, which accounted for 15% of asset growth, or more than half of the total contribution of this type of country.
Table
Percentage contribution to the growth of Canadian direct investment assets abroad, from 1990 to2003.
The United States accounted for more than a third of the growth, representing $105 billion in additional assets. The finance and service sectors were the most dynamic in that country, with respective contributions of 14% and 10%.
Other countries that are not OFCs represented 39% of new assets, equivalent to $119 billion. The bulk of this investment was made in Europe (+$70 billion). In these other countries, the processing sector was the most dynamic (18%), whereas it lagged in the United States and OFCs.
Overall, the financial sector contributed the most to the growth of direct investment assets, both in OFCs and elsewhere, registering strong gains in America and Europe. This sector accounted for almost half of new assets, representing $140 billion.
Next came the processing sector, which accounted for more than a quarter of the increase in assets. Despite an increase of $79 billion, the share of Canadian assets in this sector declined because of its weak growth in the United States. By contrast, services benefited from growth in the United States and accounted for 15% of the increase.
Lastly, the manufacturing sector, which was especially dynamic in Europe, accounted for 12% of the increase, representing approximately $37 billion in additional assets.
Concepts and data sources
Direct investment
Direct investment is investment that allows an investor to have a significant voice in the management of a company with activities abroad. To measure the actual influence over the management of a company, it is agreed that an investor who owns at least 10% of the voting equity of a company is in a direct investment relationship.13
Canadian direct investment positions abroad (assets)
This article analyses the direct investment positions held by Canadian enterprises abroad. For simplicity, the term “assets” is used in place of the technical term “direct investment positions abroad”. The position represents the total value of direct investment assets at the end of the period. The change in position from the end of one year to the next arises from the following: transactions (flows), exchange rate fluctuations, corporate reorganizations, the migration of principal owners, and shifts to non-direct investment.14
The measure of direct investment is the total value, expressed at book value, of equity, long-term debt and short-term debt (non-bank) held abroad by Canadian enterprises.15
Data sources
The data on annual Canadian direct investment positions abroad come primarily from the balance of payments survey of Capital Invested Abroad by Canadian Enterprises. The data for 2003 are preliminary.
The information collected is supplemented by other balance of payments surveys:
- Capital Invested in Secondary Foreign Companies by Canadian Enterprises;
- Canadian Investment in Non-Canadian Corporations; and
- Transactions Between Canada and Other Countries.
A limitation of this study is related to the survey of Capital Invested in Secondary Foreign Companies by Canadian Enterprises. For respondents to that survey (primarily holding companies), the value of primary foreign investment is distributed according to secondary subsidiaries and associates. For example, a direct investment in a primary subsidiary in the Bahamas will be broken down according to the latter’s direct investment in its own foreign subsidiaries. The value of the assets will ultimately be associated with these other countries when the information is available. In this study, that results in an under-evaluation of Canadian assets in OFCs, since these countries, by their nature, are more likely to be used as intermediaries.
Footnotes
- International Monetary Fund, Offshore Financial Centers, IMF Background Paper, Monetary and Exchange Affairs Department, June 2000, Table 2.
- All countries that are not OFCs, except the United States.
- Robert Lipsey, 1999, The Role of Foreign Direct Investment in International Capital Flows, National Bureau of Economic Research, Working Paper 7094, Cambridge, p. 1.
- United Nations Conference on Trade and Development, 2003, World Investment Report 2003: FDI Policies for Development: National and International Perspectives, United Nations, New York and Geneva, p. 85.
- United Nations Conference on Trade and Development, 2003, World Investment Report, main data.
- Special groupings by the 1980 Standard Industrial Classification for companies (SIC–C).
- Includes extraction, processing, manufacturing and wholesaling activities in the following sectors: food, wood, energy, textiles, chemicals and metal products.
- Includes transportation, communications, education, accommodation, retailing services, etc.
- Includes machinery and equipment, transportation equipment and, electrical and electronic products manufacturing.
- Portfolio investment companies, mortgage companies and holding companies.
- Consumer loan, business finance, and security, mortgage and commodity brokerage.
- The ratio between the change (growth) in a dimension and the total change in Canadian assets abroad during the period.
- Statistics Canada, 2000, Canada’s Balance of International Payments and International Investment Position: Concepts, Sources, Methods and Products, Statistics Canada Catalogue No. 67-506-XPE, Department of Industry, Ottawa, p. 67.
- Ibid., p. 89.
- Ibid., p. 89.