
Statistics Canada
www.statcan.gc.ca
Common menu bar links
Consumer Holiday Shopping Patterns

Archived Content
Information identified as archived is provided for reference, research or recordkeeping purposes. It is not subject to the Government of Canada Web Standards and has not been altered or updated since it was archived. Please "contact us" to request a format other than those available.
by Yiling Zhang
Distributive Trades Division
Summary
Moderate gains during the 2003 holiday season
Most retailers benefit from holiday sales, but not all
Holiday sales meant big bucks to department stores
Shopping for big-ticket holiday items started earlier
Last minute rush for less expensive Christmas gifts
Is the holiday season extending to January?
Summary
The traditional last-minute Christmas shopping spree may not be so last-minute as you think. True, many consumers make an 11th hour rush to the local mall to fill up those Christmas stockings. But analysis of retail sales shows there is a tad more method to shoppers’ madness.
Data show, in effect, that consumers start buying big-ticket items, such as furniture, electronic equipment and appliances, in November. But they wait until December to buy less expensive Christmas gifts.
For example, retailers who sell mostly expensive items, such as furniture, electronic equipment and appliances, had sales in November 2003 that were 12.4% higher than the monthly average for the entire year.
In contrast, retailers specializing in less expensive items, such as CDs and toys, had sales in December last year that were 65.3% higher than the monthly average for the entire year—after a relatively quiet November. This suggests that a lot of shoppers tended to wait until the last minute to buy less expensive gifts.
Retailers tweaked staffing levels in anticipation of these Holiday shopping patterns. Employment levels rose sooner for stores selling mostly big-ticket items, and more sharply in December for stores offering primarily less expensive items.
If you think that January is busier than it used to be, you’re probably right. Data also show that consumer spending in retail stores has eased off in November and December, and gained ground in January.
The traditional decline in sales in January may not be as severe as it has been in the past, at least for some retailers. For example, for general merchandise stores, January sales in 2001 dropped by 25.2% relative to the previous year monthly average. The corresponding decline in January 2004 was only 19.7%.
Overall, retailers sold more than $330.5 billion worth of goods and services in 2003. Sales for the holiday season—that is, November and December combined—amounted to $59.5 billion, or 18% of the total.
This study examines the impact of Christmas shopping on retail sales and employment for the months of November, December and January by store type. Stores that showed a peak in sales during the 2003 holiday season are grouped by cost of items: more expensive, medium and less expensive.
General merchandise stores represent their own group. They offer a variety of holiday items ranging from relatively more expensive to relatively less expensive.
Data sources
The Monthly Retail Trade Survey (MRTS) collects sales and the number of retail locations by province and territory from a sample of about 7,500 retail businesses. The MRTS universe is based on the 2002 North American Industry Classification System (NAICS 2002). Retail sales estimates do not include any form of direct selling that bypasses the retail store, e.g., direct door-to-door selling. The data used in this study are not adjusted for seasonality.
The Survey of Employment, Payrolls and Hours (SEPH) is produced from the combination of the Business Payroll Survey results and the payroll deductions administrative data received from the Canada Revenue Agency. It provides detailed information on the total number of paid employees, payrolls and hours at detailed industrial, provincial and territorial levels. This study uses retail industry employment information (excluding non-store retailers) from SEPH.
The Quarterly Retail Commodity Survey (QRCS) collects detailed information about retail commodity sales in Canada from a sub-sample of the MRTS sample. MRTS gathers total monthly retail sales, while QRCS collects a breakdown of these sales by commodity. This study uses the information provided by QRCS to provide reasonable estimates of primary offerings by the four categories of stores mentioned below.
Definitions
Holiday season sales (or holiday sales) are defined as the total sales of November and December as driven by the high demand for Christmas, Boxing Week, New Year and other observances.
Average levels: When comparing with holiday sales (employment), average levels refer to average monthly sales (employment) for two months. When comparing with the sales of a single month, average levels refer to average monthly sales (employment).
For the purposes of discussion, stores that showed a sales peak during the 2003 holiday season are grouped into the following four categories (see this table for further details).
More expensive item stores encompass Furniture stores, Home furnishing stores, and Electronics and appliance stores. Their major offerings are relatively more expensive items, sometimes referred to as big-ticket items, such as furniture, draperies and bedding, artwork and home decorating products, television & audio/video equipment, computers and components, and cameras.
Medium expensive item stores include Pharmacies and personal care stores, Clothing stores, Shoe, clothing accessories and jewellery stores. They primarily offer such holiday items as cosmetics and fragrances, clothing and accessories, shoes and jewellery. In general, these items are relatively less expensive than the big-ticket items.
Less expensive item stores take in Beer, wine and liquor stores, and Sporting goods, hobby, music and book stores. Holiday items such as toys, games and hobby supplies, pre-recorded audio/video tapes & discs, and wines are their primary offerings. In general, these holiday items rank lower in relative expensiveness than the medium expensive holiday items. (For Sporting goods, hobby, music and book stores, less expensive holiday items accounted for more than two thirds of the 4th quarter sales in 2003 while medium expensive holiday items accounted for about a quarter.)
General merchandise stores include department stores and other general merchandise stores such as warehouse club stores. They offer a wide variety of holiday items ranging from more expensive to less expensive.
Moderate gains during the 2003 holiday season
Shoppers spent a total of nearly $60 billion in retail stores during the 2003 holiday season (November and December), a moderate 2.0% gain from the previous year. In December alone, over $32 billion worth of goods and services were sold, a 3.2% increase over December 2002.
Overall, retailers enjoyed a favourable market environment during the 2003 holiday season. Higher employment, more real disposable income and historically low interest rates induced shoppers to spend more. Low inflation, due in part to the strengthening Canadian dollar in 2003, also helped boost shoppers’ patronage.1
Higher demand translated into more jobs in the retail industry (excluding non-store retailers). Compared with December 2002, nearly 38,000 more jobs were created, bringing total retail jobs to a peak level of 1.62 million in December 2003.
Table
Overview of retailer performance during the 2003 holiday season
Most retailers benefit from holiday sales, but not all
Most retail stores were much busier during the 2003 holiday season. Ten out of fifteen store types registered significantly higher sales in November and December, compared to average levels.
Percentage change in 2003 holiday sales relative to average levels

Not all stores benefited from the Christmas shopping bonanza. Sales increased only marginally for some stores, while actually dropping for others. In fact, sales were fairly evenly distributed across the whole year in 2003 for Supermarkets and Convenience and specialty food stores. Sales by Motor vehicle and parts dealers, Gasoline stations, and Building and outdoor home supplies stores declined during the holiday season. Their sales peaks were primarily in the spring and summer months.2
The stores that did not show sales peaks during the 2003 holiday season are excluded from further study of holiday shopping patterns.
Holiday sales meant big bucks to Department stores
Department stores were the busiest during the holiday season. Their sales were more than 50% higher than average in November and December 2003, with nearly a quarter of total annual sales occurring in just two months.
Shoppers spent $5.2 billion in Department stores, the highest expenditure among all stores that showed a sales peak during the 2003 holiday season. Of every $10 spent in these stores, almost $2 went to Department stores.
Department stores offer a wide variety of holiday items. They strive to be the shopper’s one-stop shopping destination. This is particularly attractive to shoppers who have limited time and a long shopping list or families with a variety of tastes.
Among other stores, the busiest during November and December sold popular holiday items. Take a peak at the Christmas shopping bag: popular Christmas gifts such as DVD players, digital cameras, music CDs, DVD movies, clothing, shoes, toys, and jewellery were sold by these stores.
Sales were almost 50% higher than usual for Electronics and appliance stores, and represented about a quarter of their total annual sales. However, these stores accounted for only slightly less than 10 cents of every Christmas dollar, ranking them the fifth in terms of share of holiday spending.
Sporting goods, hobby, music and book stores were the third busiest with 44% higher sales during November and December 2003. Their sales represented only 7.5% of the total holiday season spending.
Shoe, accessories and jewellery stores and Clothing stores were also close behind with a similar boost in sales. Shoppers spent a total of $1.2 billion to buy shoes, clothing accessories and jewellery, while they spent nearly three times that amount in Clothing stores during the 2003 holiday season.
Table
Holiday expenditures, by store type, Canada, November and December 2003
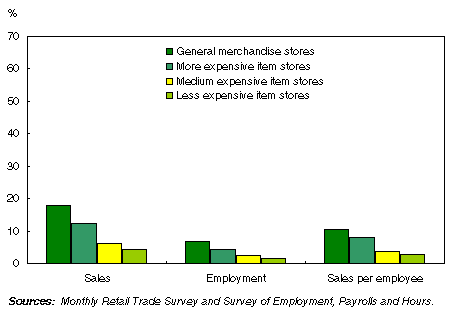
Shopping for big-ticket holiday items started earlier
Shoppers started purchasing big-ticket holiday items weeks ahead of Christmas. General merchandisers and more expensive item stores were getting busier in November, as evidenced by sales, employment and sales per employee, which rose significantly above average levels. The sales of these stores ranked the highest among all groups of stores. For example, Furniture stores, Home furnishing stores, Electronics and home appliance stores sold a total of $2.1 billion in November, a 12.4% increase above their average monthly sales of $1.9 billion.
In contrast, less expensive item stores remained relatively quiet in November, as sales, employment and sales per employee were only marginally above average levels. Beer, wine and liquor stores as well as Sporting goods, hobby, music and book stores sold $1.9 billion of goods and services in November, only 4.2% above their average monthly sales of $1.8 billion.
Percentage change in sales, employment and sales per employee relative to average levels, by store type, Canada, November 2003
The purchase of big-ticket holiday items such as furniture, electronics, and household appliances involves higher dollar amounts, and in some cases, must be made in advance because of delivery and installation times. Such purchases may also be used by the recipient for a number of years to come. Therefore, shoppers tend to plan and shop earlier for these items.
Last minute rush for less expensive Christmas gifts
Less expensive item stores waited until December to shine. For this category, sales increased marginally in November but jumped 65.3% above average levels in December, leapfrogging from last place in November to first place in December.
Considerable increases in December sales, relative to average levels, were also observed in the other groups encompassed by this study.
Corresponding to the high level of sales, December saw a significant increase in level of employment and per employee sales over November in these stores, reflecting higher retailer productivity driven by higher demand, and possibly a shift of employee activities from decorating stores and preparing for holiday inventories to directly serving shoppers.
Percentage change in sales, employment and sales per employee relative to average levels, by store type, Canada, December 2003

When it comes to the purchase of less expensive Christmas items such as toys, music CDs, books, games, and wines, because of the smaller dollar amounts involved and the lower commitment, ad hoc decisions can be made more effortlessly. Shoppers tend to wait a bit later so that they can maximize the value they get by catching the latest trend, technology and/or the best prices.
Is the holiday season extending to January?
The holiday season’s feverishly high level of shopper and retailer activity is traditionally followed by a significant slowdown in January. While the same pattern continued to hold true, January sales have also shown a distinct tendency to decline by smaller and smaller amounts for all types of stores, except those selling more expensive items.
There appears to be an emerging trend toward more subdued peaks and troughs. Holiday sales did not increase in 2003 as much as they did five years ago while January sales in 2004 did not drop as far as they did before. This is as though some holiday-related expenditures were being transferred to January.
Percentage change in November and December sales and January sales of the following year relative to average levels, by store type, Canada, 1999 to 2003
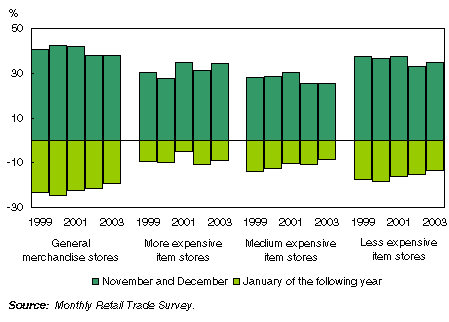
For example, in General merchandise stores, holiday sales in 2000 were 42.5% higher than average levels for the same year. By 2003, this figure was only 37.9%.
Subsequent January sales declines were also more toned down. While January 2001 sales sank 25.2% below year 2000 average levels, January 2004 sales were comparatively robust—only falling to 19.7% below the 2003 average.
Similar patterns were also observed in medium expensive item stores and less expensive item stores. For example, in Clothing stores, holiday sales did not increase as much in 2003 (40.5% above average levels) as they did in 2000 (43.8%), while subsequent January sales did not drop as much in 2004 (22.5% below the previous year average levels) as they did in 2001 (25.0%).
The use of gift cards by savvy retailers may be behind this trend. Although there is a lack of Canadian survey data on gift card sales, according to industry sources and research reports, gift cards are growing in popularity.3 In general, gift cards are not recorded as sales when they are purchased during the holiday season, but only when they are redeemed, which "predominantly happens in January."4 Moreover, gift cards are normally priced within the range of $25 and $50, rarely exceeding $200 in value, restricting their use for the purchase of big-ticket items.
Footnotes
- See R. Chiru, 2004, "The Soaring Loonie and Prices: Lower Inflation for Consumers," Analysis in Brief, Statistics Canada Catalogue no. 11-621-MIE-2004014.
- In 2003, holiday sales were merely 2.1% higher than average levels for Supermarkets; and 3.4% higher for Convenience and specialty food stores. Sales of Building and outdoor home supplies stores peaked from May to July at nearly a quarter (24.4%) above average levels. Motor vehicle and parts dealers were busier from April to July as the sales were about 18.2% above average levels.
- See J. Praw, 2004, Gift cards are here to stay, why retailers should take them more seriously!, J.C. Williams Group, Toronto.
- See "Retail trade, January 2004", The Daily, March 26, 2004