Common menu bar links
A new look: retail clothing sales in Canada
Archived Content
Information identified as archived is provided for reference, research or recordkeeping purposes. It is not subject to the Government of Canada Web Standards and has not been altered or updated since it was archived. Please "contact us" to request a format other than those available.
by Jane Lin

Hip clothing and celebrity endorsements — all part and parcel of unisex clothing stores, the champions of Canada’s retail clothing industry.
Unisex clothing stores are located in virtually every shopping mall, usually with men’s wear on one side and women’s on the other. During the past six years, these stores have captured a growing share of the market from traditional men’s and women’s clothing stores.
In 1997, unisex clothing stores — known as other clothing stores in the Monthly Retail Trade Survey — accounted for just over one-quarter (26%) of all clothing and accessories sales in Canada. By 2002, this proportion had ballooned to almost one-third (32%), with estimated sales of $6.7 billion.
Specialized men’s clothing stores have watched as some shoppers abandoned their outlets to buy men’s wear from unisex clothing stores, leaving in their wake a dramatic drop in sales for these retailers in 2001 and 2002. Despite this, men still prefer to purchase suits at men’s clothing stores over other types of stores.
Women’s clothing stores still have a strong hold on women’s apparel and accessories. However, competition from unisex clothing chains is weakening this grip.
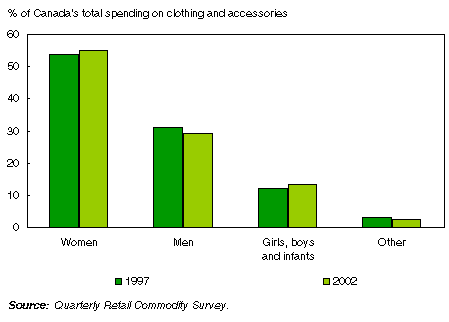
Purchases of women’s clothing and accessories account for over 50 cents of every dollar spent in 2002 on clothing and accessories, almost twice as much as the amount spent on men’s clothing and accessories. So it is no wonder retailers would like a larger portion of these sales.
This article analyzes trends in Canada’s $21 billion of retail clothing sales from 1997 to 2002, using data from two Statistics Canada surveys: the Quarterly Retail Commodity Survey and the Monthly Retail Trade Survey.
Data sources and definitions
The Monthly Retail Trade Survey (MRTS) collects sales and the number of retail locations by province and territory from a sample of roughly 12,000 retail businesses. The MRTS universe is based on the 1980 Standard Industrial Classification. Each month’s data for retail sales are published by province and for 16 trade groups in The Daily, Statistics Canada’s official release bulletin.
The Quarterly Retail Commodity Survey (QRCS) looks at commodity sales within and across various types of stores. The sample is a subset of the MRTS sample, and includes more than 8,000 businesses and 100 commodities. It supplements the MRTS by providing a breakdown of retail sales by commodity.
Consumers spend almost as much on clothes and accessories as on gas and motor oil
Overall, consumers spent $307 billion in retail stores in 2002, with clothing and accessories representing almost 7% of the total, or around $21 billion. This was almost as much as the $23 billion motorists spent last year on gasoline and motor oil.
The annual pace of growth in retail sales of clothing and accessories has slowed from 7.0% in 1998 to 1.1% in 2002. The average growth rate was 3.6% each year between 1998 and 2002. This sales growth has been affected by clothing prices, which have weakened during the past two years after remaining relatively stagnant.
Women’s clothing and accessories rule the cash register
More than one-half of every dollar spent on clothing and accessories in 2002 went towards women’s clothing and accessories. Men’s clothing and accessories commanded a comparatively smaller 29%, while clothing and accessories for girls, boys and infants, and other apparel made up the rest.
This picture has remained stable over time.
Chart
Women’s clothing: over half of spending

What Canadians purchase: a peek inside the closet
In 2002, consumers spent $11.5 billion on women’s clothing and accessories and $6.1 billion on men’s clothing and accessories. Despite this large difference in total spending, a breakdown of spending by type of clothing reveals that men’s and women’s wardrobes are surprisingly similar. The only exception is in undergarments, sleepwear and hosiery.
The bulk of what most people buy are termed "separates". For women, these items include skirts, pants (dress and casual), blazers and jackets, blouses, sweaters and other tops and bottoms. For men, they include pants and slacks, shirts (dress and casual), sweaters, and other tops and bottoms. In 2002, 57% of women’s wardrobes consisted of separates, as did 56% of men’s wardrobes.
In women’s wear, undergarments, sleepwear and hosiery were the second most valuable category, accounting for 15% of spending. However, in men’s wear, shoppers spent proportionately more money on men’s outerwear, which accounted for 13% of their spending, while underwear, sleepwear and socks represented only 8% for men.
Chart
Men’s and women’s wardrobes similar in proportion

Unisex stores replace general merchandisers as clothing titans
Between 1997 and 2002, unisex clothing stores have become the champions of Canada’s retail clothing industry. By appealing to men and women of different ages, they have attracted more customers and increased sales year after year.
In contrast, specialized men’s clothing stores have suffered declining sales, while sales in women’s clothing stores have seen relatively little change since 1997.
Chart
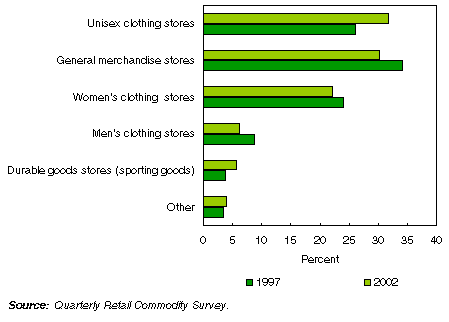
Unisex clothing stores vault to 1st place with 32% of market share

The numbers are revealing: in 2002, unisex clothing stores represented 32% of all clothing sales, up from 26% in 1997.
However, the two specialized clothing stores lost market share. During the same period, the share of women’s clothing stores edged down from 24% to 22%, while the share for men’s clothing stores shrank from 9% to 6%.
While they are not dedicated clothing outlets, general merchandise stores, durable goods stores and other types of stores are also important players, with 40% of the market share in clothing and accessories in 2002.
In 1997, general merchandise stores — which include department stores — were the best sellers of clothing and accessories with just over one-third (34%) of total sales. However by 2002, this share had dropped to 30%.
Durable goods stores, which include sporting goods stores, and other stores, such as supermarkets, shoe stores, toy stores and the like, increased their market share of clothing and accessories sales over 1997.
Several factors played a role in determining winners and losers. These include the closure of a major Canadian department store in 1999; the arrival of well-known unisex clothing chains to Canada in early 2000; and more relaxed attitudes towards attire in the work place.
Women’s clothing stores still number one in women’s wear
Of the $11.5 billion spent on women’s clothing and accessories in 2002, consumers spent $4.5 billion or 39% of the total in women’s clothing stores. This market share, while still the highest was down five percentage points from 44% in 1997.
In contrast, shoppers spent about $3.3 billion at unisex clothing stores in 2002. This accounted for 28% of the total, up a very significant seven percentage points from only 21% in 1997.
Most of the remainder, about 26% was spent at general merchandise stores, which include department stores. This proportion was down from 30% in 1997.
Chart
Women’s clothing shops losing share but still no.1

Dramatic loss of market share for men’s clothing stores
In contrast to sales at women’s clothing stores, which have been relatively stable since the autumn of 2000, men’s clothing outlets have suffered a dramatic decline since the fall of 2000. They lost ground to unisex clothing retailers and durable goods stores (of which sporting goods stores are a major component).
In 2002, shoppers spent a total of $6.1 billion on men’s clothing and accessories. About $1.3 billion of this total was spent in men’s clothing stores, down 4.3% from 2001. This followed a larger 6.6% sales drop in these stores in 2001 compared to the previous year.
As a result, men’s clothing shops have lost considerable market share. In 2002, they accounted for a relatively small 21% of the entire market, down from 27% in 1997.
General merchandise stores have also seen better days. In 1997, they led the field in sales of men’s clothing and accessories. However, that was before the closure of a major department store in 1999.
At the same time the market share for unisex clothing stores rose from 29% in 1997 to 35% in 2002.
Chart
Men’s clothing shops lost considerable market share

Consumers were not spending less on men’s clothing and accessories. In fact, total sales of $6.1 billion were well above the level of $5.4 billion in 1997. Rather, some consumers left men’s clothing stores to shop at other types of stores — namely unisex clothing stores.
Despite the rising popularity of unisex clothing stores, men overwhelmingly preferred to purchase their suits, jackets and blazers from men’s clothing stores. In 2002, men’s clothing stores captured 63% of sales for these items, up from 61% in 1997.
In addition, unisex clothing retailers were not the only shops to increase their market share. Durable goods stores have enjoyed an increase in their share of the market for men’s clothing and accessories. Between 1997 and 2002, their share rose from 6% to 10%, this increase was mostly in sporting goods stores.

