
Chart 5
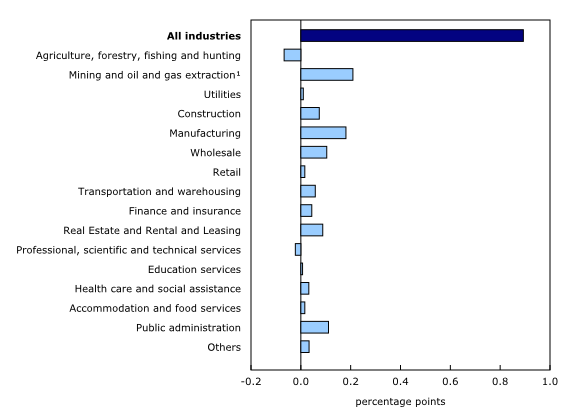
Main industrial sectors' contribution to the percent change in gross domestic product in the second quarter
1.
Includes quarrying.
Source(s):
Gross domestic product by industry (1301).
Chart description
This is a bar clustered chart.
| percentage points | |
|---|---|
| All industries | 0.893 |
| Agriculture, forestry, fishing and hunting | -0.067 |
| Mining and oil and gas extraction¹ | 0.209 |
| Utilities | 0.010 |
| Construction | 0.074 |
| Manufacturing | 0.181 |
| Wholesale | 0.104 |
| Retail | 0.016 |
| Transportation and warehousing | 0.058 |
| Finance and insurance | 0.044 |
| Real Estate and Rental and Leasing | 0.088 |
| Professional, scientific and technical services | -0.022 |
| Education services | 0.007 |
| Health care and social assistance | 0.032 |
| Accommodation and food services | 0.016 |
| Public administration | 0.111 |
| Others | 0.033 |
1.
Includes quarrying.
Source(s):
Gross domestic product by industry (1301).
- Date modified: