
Chart 5
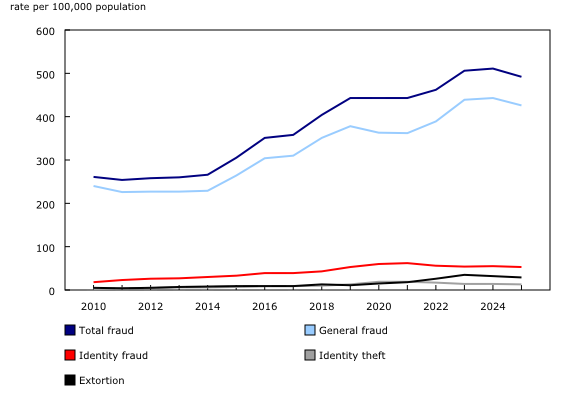
Fraud and extortion, police-reported rates, Canada, 2010 to 2025
Note(s):
As of 2010, reporting requirements for total fraud include separate violations for fraud, identity theft and identity fraud, which, combined, make up total fraud. Prior to 2010, different types of fraud were reported simply as fraud, therefore fraud data are only presented from 2010 onwards. Populations are based on July 1 estimates from Statistics Canada, Centre for Demography.
Source(s):
Uniform Crime Reporting Survey (3302).
Chart description
This is a line chart.
| Total fraud | General fraud | Identity fraud | Identity theft | Extortion | |
|---|---|---|---|---|---|
| 2010 | 261 | 240 | 18 | 2 | 5 |
| 2011 | 254 | 226 | 23 | 4 | 4 |
| 2012 | 258 | 227 | 26 | 5 | 5 |
| 2013 | 260 | 227 | 27 | 6 | 7 |
| 2014 | 266 | 229 | 30 | 6 | 8 |
| 2015 | 305 | 264 | 33 | 7 | 9 |
| 2016 | 351 | 304 | 39 | 9 | 9 |
| 2017 | 358 | 310 | 39 | 9 | 9 |
| 2018 | 404 | 351 | 43 | 10 | 13 |
| 2019 | 443 | 378 | 53 | 13 | 11 |
| 2020 | 443 | 363 | 60 | 19 | 15 |
| 2021 | 443 | 362 | 62 | 19 | 18 |
| 2022 | 462 | 389 | 56 | 17 | 26 |
| 2023 | 506 | 439 | 54 | 14 | 35 |
| 2024 | 511 | 443 | 55 | 14 | 32 |
| 2025 | 492 | 426 | 53 | 13 | 29 |
Note(s):
As of 2010, reporting requirements for total fraud include separate violations for fraud, identity theft and identity fraud, which, combined, make up total fraud. Prior to 2010, different types of fraud were reported simply as fraud, therefore fraud data are only presented from 2010 onwards. Populations are based on July 1 estimates from Statistics Canada, Centre for Demography.
Source(s):
Uniform Crime Reporting Survey (3302).
- Date modified: