
Chart 2
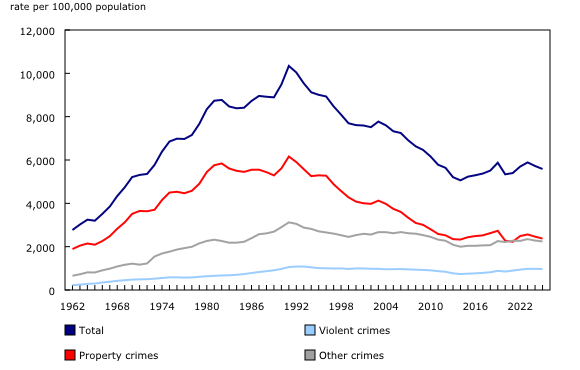
Police-reported crime rates, Canada, 1962 to 2025
Note(s):
There are two versions of the Uniform Crime Reporting (UCR) Program collection instrument that operate simultaneously: the Aggregate UCR Survey, or UCR1, and the Incident-based UCR Survey, or UCR2. The UCR1 collects summary data by offence type and has been collected since 1962, permitting a longer historical comparison than the UCR2. The UCR2, introduced in 1988, collects more detailed information on incidents, victims and accused persons, and includes a more detailed set of violation categories. As a result, information in this chart may not match data produced using UCR2 violation categories or incident-based UCR2 microdata. Crime rates are based on Criminal Code incidents, excluding traffic violations. Populations are based on July 1 estimates from Statistics Canada, Centre for Demography.
Source(s):
Uniform Crime Reporting Survey (3302).
Chart description
This is a line chart.
| Total | Violent crimes | Property crimes | Other crimes | |
|---|---|---|---|---|
| 1962 | 2,771 | 221 | 1,891 | 659 |
| 1963 | 3,022 | 249 | 2,047 | 726 |
| 1964 | 3,245 | 284 | 2,146 | 815 |
| 1965 | 3,199 | 299 | 2,091 | 809 |
| 1966 | 3,511 | 347 | 2,258 | 907 |
| 1967 | 3,850 | 381 | 2,484 | 985 |
| 1968 | 4,336 | 423 | 2,826 | 1,087 |
| 1969 | 4,737 | 453 | 3,120 | 1,164 |
| 1970 | 5,212 | 481 | 3,515 | 1,217 |
| 1971 | 5,311 | 492 | 3,649 | 1,170 |
| 1972 | 5,355 | 497 | 3,634 | 1,224 |
| 1973 | 5,773 | 524 | 3,704 | 1,546 |
| 1974 | 6,388 | 553 | 4,151 | 1,684 |
| 1975 | 6,852 | 585 | 4,498 | 1,769 |
| 1976 | 6,984 | 584 | 4,533 | 1,867 |
| 1977 | 6,971 | 572 | 4,466 | 1,933 |
| 1978 | 7,154 | 580 | 4,579 | 1,995 |
| 1979 | 7,666 | 610 | 4,903 | 2,153 |
| 1980 | 8,343 | 636 | 5,444 | 2,263 |
| 1981 | 8,736 | 654 | 5,759 | 2,322 |
| 1982 | 8,773 | 671 | 5,840 | 2,262 |
| 1983 | 8,470 | 679 | 5,608 | 2,182 |
| 1984 | 8,387 | 701 | 5,501 | 2,185 |
| 1985 | 8,413 | 735 | 5,451 | 2,227 |
| 1986 | 8,727 | 785 | 5,550 | 2,392 |
| 1987 | 8,957 | 829 | 5,553 | 2,575 |
| 1988 | 8,919 | 868 | 5,439 | 2,613 |
| 1989 | 8,892 | 911 | 5,289 | 2,692 |
| 1990 | 9,485 | 973 | 5,612 | 2,900 |
| 1991 | 10,342 | 1,059 | 6,160 | 3,122 |
| 1992 | 10,040 | 1,084 | 5,904 | 3,052 |
| 1993 | 9,538 | 1,082 | 5,575 | 2,881 |
| 1994 | 9,125 | 1,047 | 5,257 | 2,821 |
| 1995 | 9,008 | 1,009 | 5,292 | 2,707 |
| 1996 | 8,932 | 1,002 | 5,274 | 2,656 |
| 1997 | 8,475 | 993 | 4,880 | 2,603 |
| 1998 | 8,093 | 995 | 4,569 | 2,529 |
| 1999 | 7,695 | 971 | 4,276 | 2,449 |
| 2000 | 7,610 | 996 | 4,081 | 2,534 |
| 2001 | 7,592 | 995 | 4,004 | 2,593 |
| 2002 | 7,516 | 980 | 3,976 | 2,560 |
| 2003 | 7,773 | 978 | 4,125 | 2,670 |
| 2004 | 7,601 | 957 | 3,976 | 2,668 |
| 2005 | 7,326 | 962 | 3,744 | 2,620 |
| 2006 | 7,246 | 968 | 3,605 | 2,673 |
| 2007 | 6,908 | 952 | 3,335 | 2,621 |
| 2008 | 6,632 | 938 | 3,096 | 2,598 |
| 2009 | 6,462 | 926 | 3,005 | 2,531 |
| 2010 | 6,160 | 907 | 2,802 | 2,451 |
| 2011 | 5,781 | 870 | 2,586 | 2,325 |
| 2012 | 5,639 | 843 | 2,524 | 2,272 |
| 2013 | 5,207 | 769 | 2,348 | 2,089 |
| 2014 | 5,062 | 736 | 2,328 | 1,998 |
| 2015 | 5,232 | 755 | 2,437 | 2,040 |
| 2016 | 5,297 | 769 | 2,490 | 2,039 |
| 2017 | 5,375 | 791 | 2,523 | 2,060 |
| 2018 | 5,512 | 819 | 2,625 | 2,068 |
| 2019 | 5,874 | 885 | 2,732 | 2,257 |
| 2020 | 5,339 | 851 | 2,274 | 2,214 |
| 2021 | 5,396 | 896 | 2,226 | 2,274 |
| 2022 | 5,697 | 940 | 2,490 | 2,267 |
| 2023 | 5,889 | 977 | 2,564 | 2,348 |
| 2024 | 5,723 | 977 | 2,462 | 2,283 |
| 2025 | 5,585 | 969 | 2,374 | 2,241 |
Note(s):
There are two versions of the Uniform Crime Reporting (UCR) Program collection instrument that operate simultaneously: the Aggregate UCR Survey, or UCR1, and the Incident-based UCR Survey, or UCR2. The UCR1 collects summary data by offence type and has been collected since 1962, permitting a longer historical comparison than the UCR2. The UCR2, introduced in 1988, collects more detailed information on incidents, victims and accused persons, and includes a more detailed set of violation categories. As a result, information in this chart may not match data produced using UCR2 violation categories or incident-based UCR2 microdata. Crime rates are based on Criminal Code incidents, excluding traffic violations. Populations are based on July 1 estimates from Statistics Canada, Centre for Demography.
Source(s):
Uniform Crime Reporting Survey (3302).
- Date modified: