
Chart 4
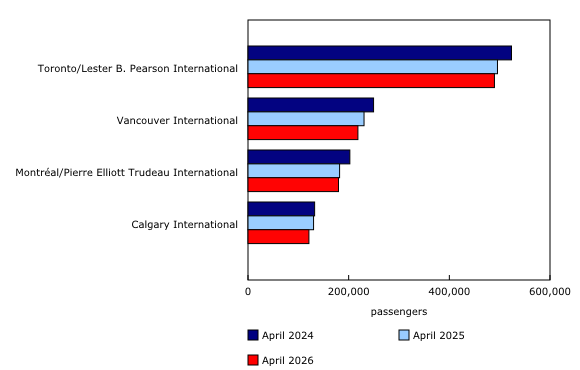
Number of screened transborder (to the United States) passengers, April, 2024 to 2026
Source(s):
Table 23-10-0312-01.
Chart description
This is a bar clustered chart.
| April 2024 | April 2025 | April 2026 | |
|---|---|---|---|
| Toronto/Lester B. Pearson International | 523,504 | 495,645 | 489,599 |
| Vancouver International | 249,471 | 230,546 | 218,341 |
| Montréal/Pierre Elliott Trudeau International | 202,327 | 181,954 | 179,792 |
| Calgary International | 132,348 | 130,229 | 121,009 |
Source(s):
Table 23-10-0312-01.
- Date modified: