
Chart 1
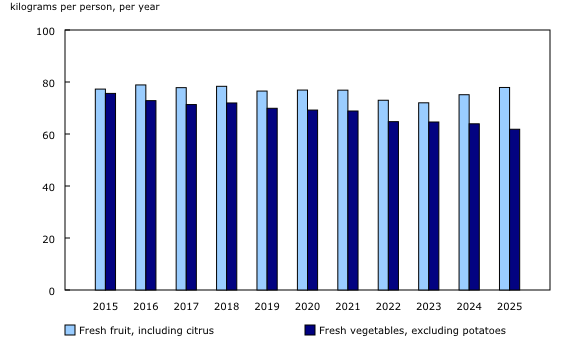
Availability of fresh fruit and vegetables
Source(s):
Table 32-10-0054-01.
Chart description
This is a column clustered chart.
| Fresh fruit, including citrus | Fresh vegetables, excluding potatoes | |
|---|---|---|
| 2015 | 77.27 | 75.61 |
| 2016 | 78.87 | 72.83 |
| 2017 | 77.83 | 71.32 |
| 2018 | 78.34 | 71.94 |
| 2019 | 76.51 | 69.89 |
| 2020 | 76.90 | 69.21 |
| 2021 | 76.86 | 68.85 |
| 2022 | 72.98 | 64.75 |
| 2023 | 71.99 | 64.61 |
| 2024 | 75.11 | 63.92 |
| 2025 | 77.90 | 61.83 |
Source(s):
Table 32-10-0054-01.
- Date modified: