
Functional health of Canadian adults, 2015 to 2024
Released: 2026-03-16
56.4%
CCHS 2024
The functional health of Canadian adults has declined over the past decade, largely due to deteriorating emotional health and the increasing prevalence of pain. Functional health, measured using the Health Utilities Index Mark 3, is an important measure of health-related quality of life (included in Canada's Quality of Life Framework) that summarizes an individual's level of difficulty in eight attributes: vision, hearing, speech, cognition, dexterity, mobility, emotional health and pain. The attributes can then be combined into a multi-attribute score summarizing the individual's overall functional health status. A score of 0.89 to 1.00 indicates very good to perfect functional health, while scores below 0.89 indicate moderate to poor functional health.
Functional health is declining, especially among young adults
The percentage of Canadian adults with very good to perfect functional health declined from 68.6% in 2015 to 56.4% in 2024. This decrease is notable given that from 1994 to 2015, mean functional health remained constant for Canadian adults under age 65, and improved for those aged 65 and older. Conversely, from 2015 to 2024, functional health remained approximately the same for Canadians age 75 and older, but decreased for all younger age groups. In all years, Canadians aged 75 and older had lower functional health than younger age groups, while among all adults aged 18 and older, females had worse functional health than males.
Functional health decreases in all provinces
The proportion of adults with very good to perfect functional health decreased from 2015 to 2024 in all provinces. Newfoundland and Labrador decreased by 6.2 percentage points, a smaller decrease than any other province. In 2024, functional health was lowest in Nova Scotia (47.7%) and New Brunswick (48.3%). Quebec had the highest functional health from 2015 to 2024, with 65.6% of Quebec residents having very good to perfect functional health in 2024.
Emotional health worsening, especially in young adults
Examining the proportion of adults with no difficulty in each attribute shows that the decline in overall functional health from 2015 to 2024 was driven mainly by changes in emotional health and pain. Emotional health, measured as the percentage who are happy and interested in life, decreased more than any other attribute, from 78.3% in 2015 to 61.2% in 2024. This decline is consistent with the decline in perceived mental health and increasing prevalence of mental disorders over the past decade. Emotional health was similar across all age groups in 2015, but in 2024, those aged 18 to 34 had worse emotional health than those aged 50 and older. Among all adults aged 18 and older, males were consistently less likely to be happy and interested in life than females (59.8% vs. 62.7% in 2024).
The percentage of adults with no pain or discomfort also decreased, from 77.9% in 2015 to 72.0% in 2024. Females and older adults were more likely to have pain, but the change over time was similar across age groups and sexes.
Related release
Functional health estimates for 2015, 2019, 2023 and 2024 are now available in Table 13-10-0966-01.
Chart 1

Percentage of Canadian adults with very good to perfect functional health, by age group, 2015, 2019 and 2024
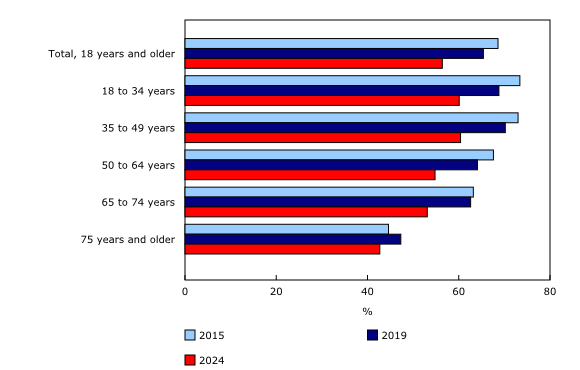
Chart 2
Percentage of Canadian adults with very good to perfect functional health, by province, 2015, 2019 and 2024

Chart 3
Percentage of Canadian adults with no difficulty in each functional health attribute, 2015, 2019 and 2024

Note to readers
The data used are from the Canadian Community Health Survey (CCHS) annual cycles in 2015, 2019, and 2024. This analysis includes only respondents aged 18 and older, living in the provinces, who responded to all functional health questions. Territorial data were not included in this analysis, given that the annual coverage of CCHS does not represent the entire population of the territories. Excluded from the survey's coverage are people living on reserves and other Indigenous settlements in the provinces, full-time members of the Canadian Forces, the institutionalized population, and residents of certain remote regions. All analyses are weighted to be representative of the population across the 10 provinces. This analysis is limited by the exclusion of the institutionalized population in particular, who have lower functional health than the household population, which may bias the cognition results especially.
Due to changes resulting from the 2015 CCHS redesign, which included an updated collection strategy, revised sample design, and significant content adjustments, caution should be taken when comparing data from previous cycles to data released for the 2015 cycle onward. Further, functional health tables published prior to 2015 reported the proportion with a score of 0.80 or higher as having very good to perfect functional health, rather than 0.89 or higher which is used for this analysis. The previous functional health tables can therefore not be compared to this new table.
In 2015 and 2019, CCHS was collected using computer-assisted telephone interviewing (CATI) and computer-assisted personal interviewing (CAPI). From 2022 onward, CCHS has been collected using an electronic questionnaire with CATI and CAPI follow-up for non-response. Comparisons between electronic questionnaire responses and CATI/CAPI responses showed that overall functional health results were not affected by the collection mode.
A binary variable for sex (i.e., male or female) was used for all years in this analysis instead of gender because gender was not asked on the 2015 CCHS, while both sex and gender were asked from 2019 onward.
The Health Utilities Index Mark 3 (HUI3) utility scores for overall functional health range from -0.36 to 1.00. A score of 0.89 to 1.00 indicates very good to perfect functional health. A score below 0.89 indicates moderate to poor functional health. These categories are derived from previously validated categories of HUI3 scores, and differ from the categories used for functional health estimates prior to 2015.
Each of the eight attributes of functioning are measured on a 5- or 6-level scale, from highly impaired to no difficulty. The attributes have varying impacts on the overall functional health score, as described by Feeny et al. Each attribute is reported as the proportion of individuals with no difficulty in that attribute. Cognition is reported as the percentage who can remember and think without difficulty. Dexterity describes full use of the hands and fingers. Emotional health includes those who reported being happy and interested in life. Hearing includes those able to hear without hearing aids. Mobility includes those able to walk without difficulty or aid. Pain includes those who reported no pain or discomfort. Speech includes those able to be well understood. Vision is reported as the percentage able to see well without glasses or contacts.
Contact information
For more information, or to enquire about the concepts, methods or data quality of this release, contact us (toll-free 1-800-263-1136; 514-283-8300; infostats@statcan.gc.ca) or Media Relations (statcan.mediahotline-ligneinfomedias.statcan@statcan.gc.ca).
- Date modified: