
Chart 3
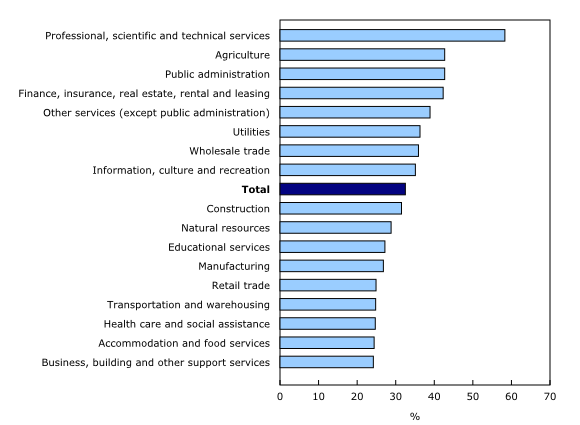
Percentage of employees with flexible schedules by industry, 2024-2025
Note(s):
Employees aged 15 to 69 living in the provinces. Employees with flexible schedules are defined as those who are able to adapt their working hours within certain limits or determine their working hours by themselves.
Source(s):
Canadian Survey on Working Conditions (5411), 2024-2025.
Chart description
This is a bar clustered chart.
| % | |
|---|---|
| Professional, scientific and technical services | 58.3 |
| Agriculture | 42.7 |
| Public administration | 42.7 |
| Finance, insurance, real estate, rental and leasing | 42.3 |
| Other services (except public administration) | 38.9 |
| Utilities | 36.3 |
| Wholesale trade | 35.9 |
| Information, culture and recreation | 35.1 |
| Total | 32.5 |
| Construction | 31.5 |
| Natural resources | 28.8 |
| Educational services | 27.2 |
| Manufacturing | 26.8 |
| Retail trade | 24.9 |
| Transportation and warehousing | 24.8 |
| Health care and social assistance | 24.7 |
| Accommodation and food services | 24.4 |
| Business, building and other support services | 24.2 |
Note(s):
Employees aged 15 to 69 living in the provinces. Employees with flexible schedules are defined as those who are able to adapt their working hours within certain limits or determine their working hours by themselves.
Source(s):
Canadian Survey on Working Conditions (5411), 2024-2025.
- Date modified: