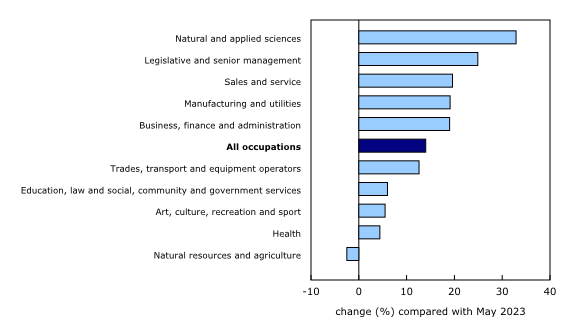
Chart 3
Largest 12-month increase in regular EI beneficiaries among those who last worked in natural and applied sciences

Source(s):
Employment Insurance Statistics (2604), table 14-10-0456-01.
Chart description
This is a bar clustered chart.
| change (%) compared with May 2023 | |
|---|---|
| Natural and applied sciences | 32.9 |
| Legislative and senior management | 24.9 |
| Sales and service | 19.6 |
| Manufacturing and utilities | 19.1 |
| Business, finance and administration | 19.0 |
| All occupations | 14.0 |
| Trades, transport and equipment operators | 12.6 |
| Education, law and social, community and government services | 6.0 |
| Art, culture, recreation and sport | 5.5 |
| Health | 4.4 |
| Natural resources and agriculture | -2.5 |
Source(s):
Employment Insurance Statistics (2604), table 14-10-0456-01.
- Date modified: