
Chart 1
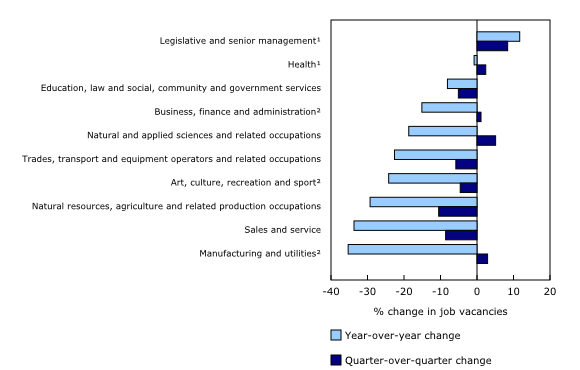
Quarter-over-quarter and year-over-year percentage decreases in vacancies vary across broad occupation groups
Note(s):
Data are adjusted for seasonality.
1.
Quarter-over-quarter and year-over-year proportional changes are not statistically significant.
2.
Quarter-over-quarter proportional changes are not statistically significant.
Source(s):
Job Vacancy and Wage Survey (5217), table 14-10-0399-01.
Chart description
This is a bar clustered chart.
| Year-over-year change | Quarter-over-quarter change | |
|---|---|---|
| Legislative and senior management¹ | 11.7 | 8.4 |
| Health¹ | -0.8 | 2.4 |
| Education, law and social, community and government services | -8.1 | -5.1 |
| Business, finance and administration² | -15.1 | 1.1 |
| Natural and applied sciences and related occupations | -18.7 | 5.1 |
| Trades, transport and equipment operators and related occupations | -22.6 | -5.8 |
| Art, culture, recreation and sport² | -24.2 | -4.6 |
| Natural resources, agriculture and related production occupations | -29.3 | -10.5 |
| Sales and service | -33.7 | -8.6 |
| Manufacturing and utilities² | -35.3 | 2.9 |
Note(s):
Data are adjusted for seasonality.
1.
Quarter-over-quarter and year-over-year proportional changes are not statistically significant.
2.
Quarter-over-quarter proportional changes are not statistically significant.
Source(s):
Job Vacancy and Wage Survey (5217), table 14-10-0399-01.
- Date modified: