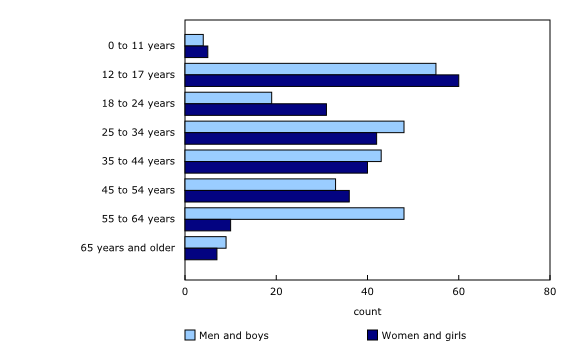
Chart 2
Number of police-reported cyber-related hate crime victims, by age and gender, Canada, 2018 to 2022

Note(s):
The "65 years and older" category excludes victims whose age is unknown or who are older than 110 years.
Source(s):
Uniform Crime Reporting Survey, 2018 to 2022 (3302).
Chart description
This is a bar clustered chart.
| Men and boys | Women and girls | |
|---|---|---|
| 0 to 11 years | 4 | 5 |
| 12 to 17 years | 55 | 60 |
| 18 to 24 years | 19 | 31 |
| 25 to 34 years | 48 | 42 |
| 35 to 44 years | 43 | 40 |
| 45 to 54 years | 33 | 36 |
| 55 to 64 years | 48 | 10 |
| 65 years and older | 9 | 7 |
Note(s):
The "65 years and older" category excludes victims whose age is unknown or who are older than 110 years.
Source(s):
Uniform Crime Reporting Survey, 2018 to 2022 (3302).
- Date modified: