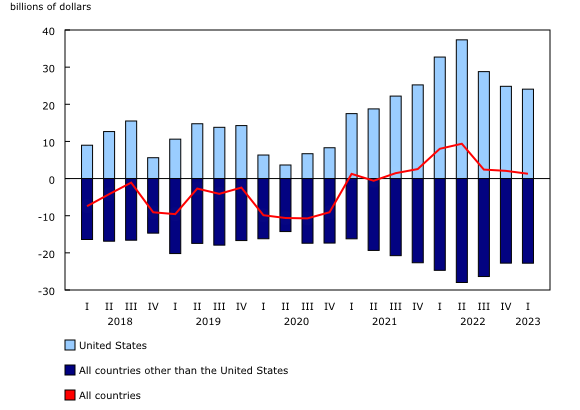
Chart 2
Goods balances by geographic area

Note(s):
Data are seasonally adjusted.
Source(s):
Table 36-10-0019-01.
Chart description
This is a combined line chart.
| United States | All countries other than the United States | All countries | |
|---|---|---|---|
| First quarter 2018 | 8.976 | -16.407 | -7.431 |
| Second quarter 2018 | 12.653 | -16.855 | -4.202 |
| Third quarter 2018 | 15.496 | -16.589 | -1.093 |
| Fourth quarter 2018 | 5.611 | -14.691 | -9.080 |
| First quarter 2019 | 10.613 | -20.186 | -9.573 |
| Second quarter 2019 | 14.763 | -17.450 | -2.687 |
| Third quarter 2019 | 13.803 | -17.916 | -4.113 |
| Fourth quarter 2019 | 14.264 | -16.689 | -2.425 |
| First quarter 2020 | 6.338 | -16.203 | -9.865 |
| Second quarter 2020 | 3.651 | -14.264 | -10.613 |
| Third quarter 2020 | 6.693 | -17.406 | -10.713 |
| Fourth quarter 2020 | 8.295 | -17.362 | -9.067 |
| First quarter 2021 | 17.489 | -16.222 | 1.267 |
| Second quarter 2021 | 18.760 | -19.342 | -0.582 |
| Third quarter 2021 | 22.204 | -20.751 | 1.453 |
| Fourth quarter 2021 | 25.221 | -22.663 | 2.558 |
| First quarter 2022 | 32.710 | -24.697 | 8.013 |
| Second quarter 2022 | 37.350 | -27.977 | 9.373 |
| Third quarter 2022 | 28.797 | -26.376 | 2.421 |
| Fourth quarter 2022 | 24.839 | -22.761 | 2.078 |
| First quarter 2023 | 24.074 | -22.782 | 1.292 |
Note(s):
Data are seasonally adjusted.
Source(s):
Table 36-10-0019-01.
- Date modified: