Study: Black Business Owners in Canada
Released: 2023-02-22
In 2018, there were an estimated 66,880 Black business owners in Canada, accounting for 2.1% of all business owners. The majority of them were men (70.4%), immigrants (61.4%) and lived in Ontario (50.6%) or Quebec (23.3%). Furthermore, black-owned businesses represented 2.9% of unincorporated businesses and 1.6% of incorporated businesses. Regardless of the type of business, those owned by Black people were on average smaller than those owned by White people or other racialized individuals.
These are some of the main findings of a new study entitled "Black Business Owners in Canada," released today by Statistics Canada. This article examines the socioeconomic characteristics of Black business owners in Canada and compares them with the characteristics of their White and other racialized counterparts. It also explores the characteristics of businesses based on the racial profile of owners.
The analysis is based on a recent linkage between the Canadian Employer–Employee Dynamics Database (2018), the Census of Population (2001, 2006 and 2016) and the 2011 National Household Survey. Along with these administrative and survey sources, imputation techniques have been applied to produce aggregate results. For the first time, these new data provide the opportunity for a more granular analysis of trends in business ownership by racial profile.
Men represent over two-thirds of Black business owners
Among Black business owners, the share of men (70.4%) was more than twice as high as that of women (29.6%). Among both White (63.1% men vs. 36.9% women) and other racialized business owners (64.9% vs. 35.1%), men also accounted for the largest proportion. However, the gap between men and women was proportionally higher among the Black population.
The proportion of Black business owners has increased over time
For the first time, this study provides trends in terms of business ownership by racial profile, sex and business type. From 2005 to 2018, the share of Black people among both incorporated and unincorporated business owners (i.e., those commonly referred to as self-employed workers) has increased for both women and men. The proportion of Black women among self-employed women grew from 1.3% in 2005 to 2.2% in 2018. Among self-employed men, the percentage of Black people almost doubled during this period, going from 1.8% in 2005 to 3.5% in 2018. The faster growth in the number of Black self-employed men relative to Black self-employed women has widened the gap between the two groups. The share of Black people among the owners of incorporated businesses also increased but at a slower pace for both women (+0.5 percentage points) and men (+0.6 percentage points).
Black and racialized business owners are mainly immigrants
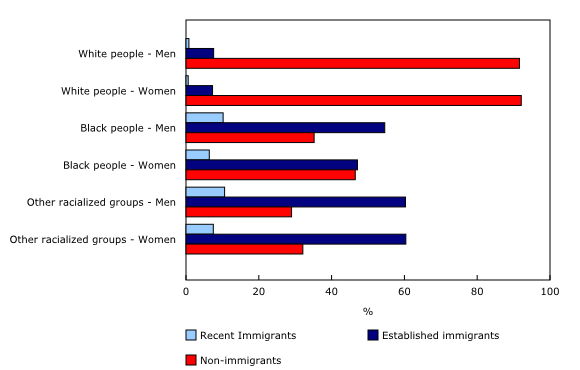
As is the case for the general Black population in Canada, according to the 2021 Census, the majority of Black business owners in 2018 were immigrants. The latter accounted for 64.8% of Black men business owners and 53.5% of Black women business owners. In other words, Black women business owners (46.5%) were more likely to have been born in Canada than Black men business owners (35.2%). Furthermore, most immigrant business owners have been in Canada for more than five years. Among both men and women business owners, other racialized individuals were proportionally more likely to be immigrants than their White and Black counterparts.
More than half of Black immigrant business owners come from five countries
The top five countries of origin of Black immigrant business owners were Nigeria (14.2%), Jamaica (12.1%), Ethiopia (10.5%), Haiti (10.2%) and Somalia (4.7%). These countries accounted for 51.7% of Black immigrant business owners. Among women (68.6%) and men (70.4%), over two-thirds of Black immigrant business owners originated from 10 countries located either in Africa or the Caribbean and Bermuda.
Which types of businesses do Black individuals own?
The article also explores the characteristics of Black-owned businesses and compares them with businesses owned by other racialized people or by White people. A Black-owned business is defined as a business in which more than 50% of the shares are owned by Black people. In 2018, Black entrepreneurs owned 2.9% of unincorporated businesses and 1.6% of incorporated businesses, whereas individuals belonging to other racialized groups owned 21.8% of unincorporated businesses and 24.2% of incorporated businesses. Furthermore, there was at least one Black owner in 3.1% of unincorporated businesses and 2.2% of incorporated businesses.
Black-owned businesses are smaller in size and perform less well financially
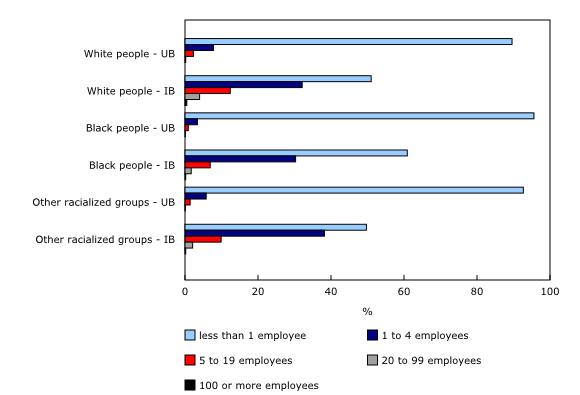
Black-owned unincorporated businesses (4.4%) were less likely to have at least one employee than those owned by White people (10.3%) and other racialized individuals (7.3%). A total of 91.2% of Black-owned incorporated businesses had fewer than five employees compared with 87.9% for other racialized groups and 83.1% for White people.
Although Black-owned businesses operated in almost all industries, they were more prevalent in transportation and warehousing (34.3% among unincorporated and 14.2% among incorporated) and in professional, scientific and technical services (10.4% and 21.3%). The distribution of black-owned unincorporated businesses by industry was comparable to that of businesses owned by White people or other racialized individuals. However, the distribution by industry of incorporated businesses owned by Black people or other racialized individuals was somewhat different from that of White-owned businesses.
Black-owned incorporated businesses performed less well financially on average than those owned by White people or other racialized groups. With lower return on assets than their White (10.6%) and other racialized (9.3%) counterparts, Black-owned businesses (5.2%) had weaker capacity to use their assets to generate gains. In addition, the profit margin was also lower for Black-owned (8.5%) businesses, meaning that businesses owned by other racialized (10.1%) or White (14.9%) entrepreneurs had a better ability to profit from their activities and to cope with rising costs or competition.
Note to readers
Data on racialized groups are measured by the Census of Population visible minority variable. The Employment Equity Act defines visible minorities as "persons, other than Aboriginal peoples, who are non-Caucasian in race or non-white in colour."
"Sex" refers to sex at birth, as gender is not a characteristic currently available in the Canadian Employer–Employee Dynamics Database.
For data on citizenship by visible minority, immigrant status and period of immigration, for Canada, the provinces, the territories and federal electoral districts, please see the table 98-10-0303-01.
For more information about the imputation, please see the publication "Identifying Indigenous Business Owners and Indigenous-Owned Businesses."
Products
The study "Black Business Owners in Canada," part of the Analytical Studies Branch Research Paper Series (11F0019M), is now available.
Contact information
For more information, or to enquire about the concepts, methods or data quality of this release, contact us (toll-free 1-800-263-1136; 514-283-8300; infostats@statcan.gc.ca) or Media Relations (statcan.mediahotline-ligneinfomedias.statcan@statcan.gc.ca).
- Date modified:


