Trade by exporter and importer characteristics: Services, 2020
Released: 2022-11-10
In 2020, exports and imports of commercial services were increasingly concentrated in five industries, with professional, scientific and technical services industries, information and cultural industries, finance and insurance industries, manufacturing industries and wholesale trade accounting for just over 80% of trade value.
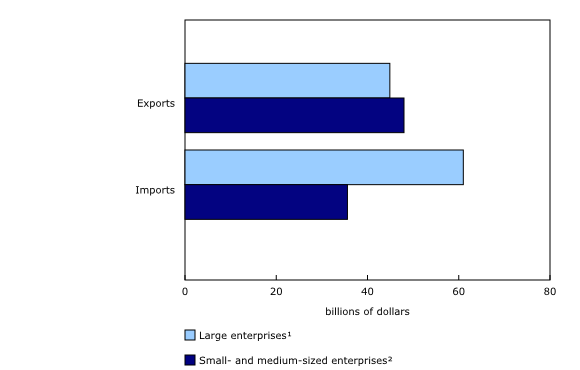
By enterprise-size, small and medium enterprises continued to be responsible for a slightly higher share of Canada's commercial services exports than large firms, while for imports, large firms accounted for the higher share. In addition, multinational enterprises accounted for three-quarters of all commercial services exports and 86% of all imports.
As noted in an analysis of Canada's trade in goods and services in 2020, imports and exports of commercial services were not as negatively affected in that first year of the COVID-19 pandemic as goods or other service categories. Unlike travel services and transportation services, which by their nature involve the physical movement of persons across borders in providing or consuming the service, many commercial services can be delivered digitally, something that likely contributed to their greater resilience.
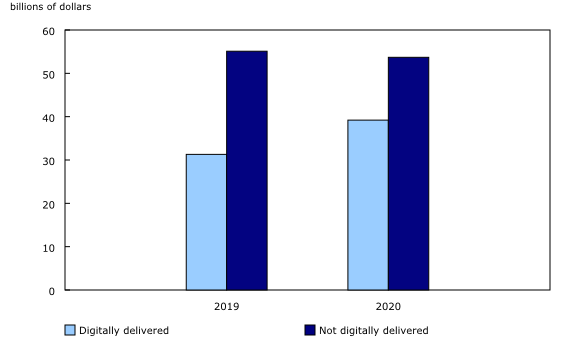
In 2020, imports ($101.4 billion) and exports ($100.2 billion) of commercial services both increased. The value of Canada's services exports reported as digitally delivered to customers abroad increased from $31.3 billion in 2019 to $39.2 billion (of the $92.9 billion of exports linked to enterprises) in 2020, yielding an overall digital intensity of 42% (up from 36% in 2019). Digitally delivered exports grew 25.2%, while non-digitally delivered commercial exports edged down in 2020.
Of the $92.9 billion in commercial services exports, enterprises that reported engagement in digital delivery in 2020 generated a total of nearly $60 billion worth of exports, an increase of over $10 billion compared with 2019. These enterprises digitally delivered two-thirds of their exports in 2020, compared with 60% in 2019. Approximately $33 billion worth of services were exported by enterprises that did not indicate engagement in digital delivery.
Canadian multinational enterprises generate 30% of commercial services export revenue in 2020
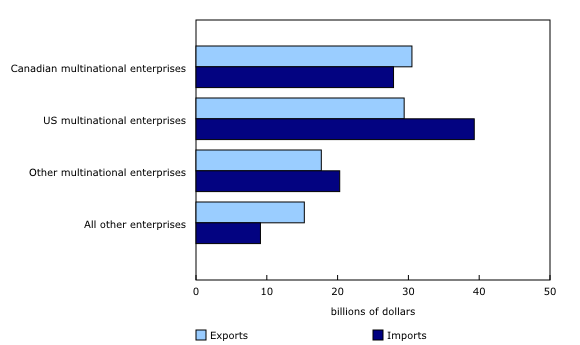
Canadian multinational enterprises (MNEs) accounted for 28% of all commercial services imports and a slightly higher share of exports (30%) in 2020.
US MNEs represented 39% of overall imports and 29% of exports activity. Non-US foreign MNEs contributed to a lesser extent to both imports (20%) and exports (18%).
Non-multinational enterprises, those not accessing international markets through foreign affiliates, accounted for 9% of import value and 15% of export value in 2020.
Of the nearly $40 billion worth of services exports that were digitally delivered in 2020, MNEs accounted for $33 billion worth of this activity. MNEs reported a slightly higher digital intensity, at 43% of overall exports, than Canadian companies without controlling interest abroad (those not accessing international markets through foreign affiliates), which digitally delivered 39% of their exports.
Small- and medium-sized enterprises account for larger share of export value in 2020 but show lower digital intensity than large counterparts
Small- and medium-sized enterprises (SMEs), those with fewer than 500 employees, continued to be responsible for a higher proportion of Canada's services exports than large enterprises, while large firms (those with 500 or more employees) accounted for a slightly higher share of imported commercial services.
The digital intensity of large firms' services exports increased from 42.6% in 2019 to 50.3% in 2020, while the digital intensity of SMEs grew from 31.8% to 34.6%.
Smaller firms that belong to a multinational enterprise group reported a digital intensity of 37%, a lower share than that reported by large enterprises belonging to a multinational enterprise group (48%).
Among non-multinational enterprises, the gap between the digital intensity for SMEs and large enterprises was even more pronounced. These SMEs reported that 28% of their $12 billion worth of services exports were digitally delivered, while large enterprises reported that over 80% of their services value was generated through digitally delivered services exports.
Enterprises that trade with both the United States and the rest of world account for more than 60% of services exports and imports
Enterprises that exported services in 2020 to both the United States and the rest of the world generated $66.1 billion worth of exports, or over two-thirds of services exports. Of these exports, 57% were destined for the United States. Services exporters that reported solely the United States as a trading partner accounted for a further $26.4 billion worth of exports in 2020, while those exporting solely to countries other than the United States accounted for the remaining $7.7 billion.
Enterprises that imported services in 2020 that purchased from both the United States and the rest of the world accounted for $63.2 billion worth of imports, over 60% of services imports, with 56% of value imported from the United States.
Digital intensity of commercial services imports
Measuring digital intensity of services imports continues to be a challenge in digital trade. This information is currently not available in Canada's international trade in services statistics, but work is underway to explore the best approaches and methodologies to eventually measure this activity. In the case of services exports, the exporter typically is responsible for ensuring that there is infrastructure for delivery of the service through digital means. The means by which services are imported is considered more challenging to report.
Enterprises that reported services imports and that also reported engagement in digital delivery of exports in 2020 accounted for $53 billion of total commercial services imports, or just over 50%. Assuming imports were digitally delivered to these enterprises at the same rate as they supplied their exported products, this approach would result in $24.4 billion worth of imports that would have been digitally delivered. This yields a digital intensity of this subset of enterprises of 46%, and overall digital intensity of imports of 25%. This experimental enterprise-based estimate indicates a higher value and share than information and communication technologies imports (17% of commercial services imports in 2020), a measure compiled through the summation of specific services categories such as telecommunication services, computer services, and charges for the use of intellectual property related to computer software.
Data by industry of importers indicate that the highest gains in services imports in 2020 were observed in information services and professional services industries, where combined imports increased by $12.6 billion in 2020. Increases were concentrated among large US multinationals importing from the United States, reflecting an acceleration in services delivered through both resident and non-resident digital platforms. The coverage of such activity continued to be enhanced in Canada's international trade in services statistics in 2020 through the adoption of emerging data sources.
Note to readers
This release includes information on international trade in services by exporters and importers characteristics, providing further insights on the profile of Canadian enterprises engaged in cross-border commercial services trade for 2010 to 2020. For more information on Canada's international trade in services, please consult the latest annual release.
In this release, a certain share of export value and import value could not be linked to a particular employment size class or multinational status as a result of limitations in data sources used to compile data on certain commercial services.
Multinational enterprises (MNEs) are corporations with majority-owned operations in more than one country. The ownership of more than 50% of voting shares by enterprises outside the country is used to identify foreign MNEs. Canadian MNEs are defined as enterprises based in Canada that own more than 50% of the voting shares of an enterprise abroad.
Small- and medium-sized enterprises (SMEs) in Canada can be part of a larger multinational framework. As a result, the analysis of the data by multinational status reflects the activities of these SMEs.
Data on digitally delivered services exports are provided for the dimensions of multinational status and enterprise size class for 2020. Digitally delivered services exporters are primarily identified through Statistics Canada's International transactions in commercial services survey, within which they are asked to identify the share of their exports that are digitally delivered per services category, combined with administrative data sources.
A background study on the survey module that contributed to the new measurement of digitally delivered services exports, "Canada's services exports through the lens of digital trade," part of Latest Developments in the Canadian Economic Accounts (13-605-X), is available.
Products
The Canada and the World Statistics Hub (13-609-X) is available online. This product illustrates the nature and extent of Canada's economic and financial relationship with the world using interactive graphs and tables. This product provides easy access to information on trade, investment, employment and travel between Canada and a number of countries, including the United States, the United Kingdom, Mexico, China and Japan.
Contact information
For more information, or to enquire about the concepts, methods or data quality of this release, contact us (toll-free 1-800-263-1136; 514-283-8300; infostats@statcan.gc.ca) or Media Relations (statcan.mediahotline-ligneinfomedias.statcan@statcan.gc.ca).
- Date modified:


