Provincial and territorial economic accounts, 2021
Archived Content
Information identified as archived is provided for reference, research or recordkeeping purposes. It is not subject to the Government of Canada Web Standards and has not been altered or updated since it was archived. Please "contact us" to request a format other than those available.
Released: 2022-11-08
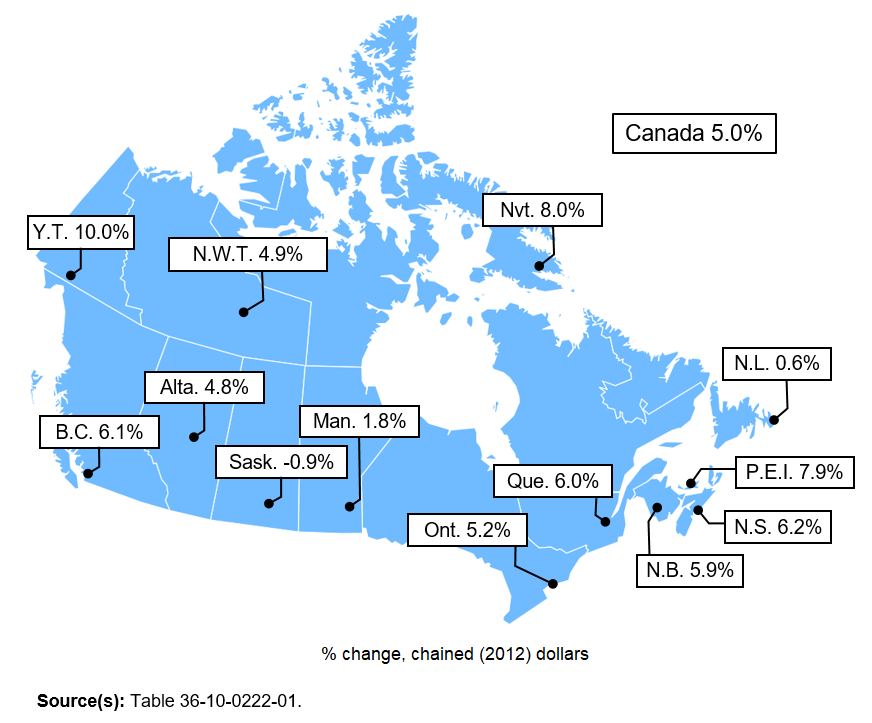
In 2021, Canada's real gross domestic product (GDP) rebounded 5.0%, following a 5.1% decline in 2020 due to the widespread shutdown in economic activity in the early stages of the COVID-19 pandemic. Reopening of the economy, combined with low interest rates and continued pandemic-related government support, resulted in substantial upturns in household spending, housing investment, and business investment.
Real GDP rose in 9 of the 10 provinces and in all 3 territories, with Saskatchewan (-0.9%) recording the only decline. Among the provinces, Prince Edward Island (+7.9%), Nova Scotia (+6.2%), and British Columbia (+6.1%) had the largest annual increases in real GDP.
Growth in Prince Edward Island and Nova Scotia was led by household spending, which increased because of reflected population growth attributable to immigration and internal migration from other provinces, as many Canadians took advantage of the ability to work remotely and relatively lower living costs in Atlantic Canada.
Growth in British Columbia was driven by household spending (+7.3%) and housing investment (+14.6%). The decline in Saskatchewan was caused by drought conditions in the Prairies that severely reduced crop production. This resulted in fewer exports (-1.6%) and lower levels of farm inventories within the province.
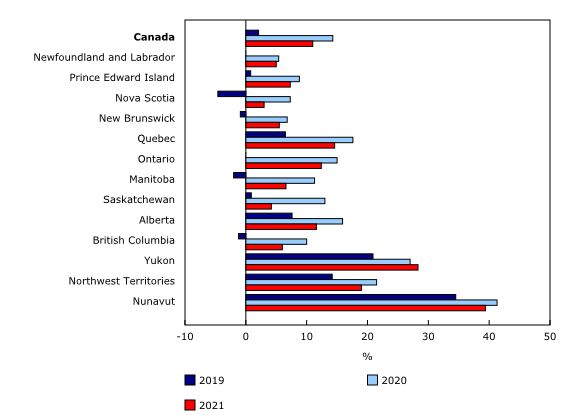
Several regions posted pronounced rebounds in the real GDP volume index, with Yukon, Nunavut, and Prince Edward Island having the largest increases. However, Newfoundland and Labrador, Manitoba, Saskatchewan, Alberta, and the Northwest Territories remained below their 2019 level.
Housing investment drives growth
Working from home, lower borrowing costs, coupled with reduced discretionary spending resulting in higher savings, boosted new home construction, renovations, and resales.
Investment in housing rose by double digits, owing to record-high spending on new construction, renovations, and ownership transfer costs. Among the provinces, Alberta (+21.5%), Saskatchewan (+20.7%) and New Brunswick (+19.1%) had the largest increases in housing investment.
As households acquired debt to buy real estate, their ability to service that debt improved as a result of increased disposable income and continued low interest rates. Based on interest-only payments, debt-service ratios decreased in each province relative to a year earlier. While households in the Atlantic provinces (below 5.0%) had the lowest debt-service ratios, these ratios were highest in Ontario (6.9%) and in British Columbia (6.6%).
Rising prices leading nominal gross domestic product growth
Canada's nominal GDP rose 13.6%, Alberta (+26.2%) recorded the largest year-over-year increase.
As employment approached 2019 levels throughout the country and lockdown measures were relaxed, wages and salaries increased 9.7% in 2021. Sharp gains in British Columbia (+12.9%) and Prince Edward Island (+11.2%) were boosted by a return to in-person services.
Growth in nominal GDP far exceeded growth in real GDP; the GDP implicit price index rose 8.2%, reflecting widespread price increases in each province and territory.
Household saving rate remains high, but down from earlier in the pandemic
In 2021, the household saving rate (11.0%) remained in double digits, although it was down from a year earlier (14.3%), its highest level since 1985. The drop in the 2021 saving rate was partly attributable to higher household spending (+8.1%), led by fuel and lubricants, food and non-alcoholic beverage services, garments, and used motor vehicles.
Saving rates were highest in Quebec (14.6%) and in Ontario (12.4%). Saskatchewan recorded the steepest drop, largely because of a reduction in farm self-employment income as a result of the drought that negatively affected harvesting. Nova Scotia and Manitoba also had relatively large reductions in household net saving, as growth in consumption expenditures outpaced that of disposable income.
Government expenditure rises in 2021
Government expenditures increased 6.4%, owing to a rise in spending on health care and payment of benefits to enable businesses and individuals to cope with the effects of the pandemic. The Canada Emergency Recovery Benefit ended in October 2021, and the Canada Recovery Benefit ended in May 2022.
Note to readers
This release incorporates revisions to the Provincial and Territorial Economic Accounts for 2019 and 2020 and estimates for 2021. Estimates of provincial-territorial gross domestic product (GDP) by industry from 2019 to 2021 were also revised. Both incorporate 2019 benchmark provincial and territorial supply and use tables, as well as revisions to the national income and expenditure accounts.
This release also incorporates T4 benchmark data for 2020 and preliminary estimates for 2021, and revised source data from surveys including the Retail Commodity Survey, the International Trade in Services Survey, and the Annual Capital and Repair Expenditures Survey for 2020.
Canada totals in the provincial and territorial (GDP) by income and by expenditure accounts do not correspond to the national (GDP) by income and by expenditure accounts estimates at certain times of the year. The two accounts are brought back in line when annual revisions are incorporated with the third quarter release (November 29, 2022).
Percentage changes for expenditure-based statistics (such as household spending, exports and imports) are calculated from volume measures adjusted for price variations.
For more information on GDP, see the video "What is Gross Domestic Product (GDP)?"
Support measures by governments
To alleviate the economic impact of the COVID-19 pandemic, governments implemented several programs, including the Canada Emergency Wage Subsidy, the Canada Emergency Rent Subsidy and the Canada Recovery Benefit. For a comprehensive explanation of how government support measures were treated in the compilation of the estimates, see "Recording COVID-19 measures in the national accounts" and "Recording new COVID measures in the national accounts."
Details of some of the more significant government measures can be found in the table Federal government expenditures on COVID-19 response measures.
Products
Provincial and territorial gross domestic product by income and expenditure accounts
Provincial and territorial gross domestic product (GDP) by income and expenditure accounts includes estimates of income- and expenditure-based GDP, real GDP, contributions to percent change in real GDP, implicit price indexes, the current accounts for the household sector, the property income of households, and other selected indicators for the household sector.
The data visualization product "Provincial and territorial economic accounts: Interactive tool," which is part of Statistics Canada—Data Visualization Products (71-607-X), is now available.
The Latest Developments in the Canadian Economic Accounts (13-605-X) is available.
The User Guide: Canadian System of Macroeconomic Accounts (13-606-G) is available.
The Methodological Guide: Canadian System of Macroeconomic Accounts (13-607-X) is available.
Gross domestic product by industry – Provincial and territorial (annual)
Revised figures from 2019 to 2021 provincial and territorial GDP by industry are included with this release.
The data visualization product "Gross domestic product (GDP) by industry, provinces and territories: Interactive tool" was also revised for the 2019-to-2021 period. This tool makes it easier for users to consult GDP data as part of Statistics Canada's corporate vision to make data more accessible in useful ways.
Contact information
For more information, or to enquire about the concepts, methods or data quality of this release, contact us (toll-free 1-800-263-1136; 514-283-8300; infostats@statcan.gc.ca) or Media Relations (statcan.mediahotline-ligneinfomedias.statcan@statcan.gc.ca).
- Date modified:


