Tuition fees for degree programs, 2022/2023
Released: 2022-09-07
New data from the Tuition and Living Accommodation Costs (TLAC) survey show the extent to which inflation affects full-time postsecondary students regarding their tuition fees and other costs. Data tables accompanying this release have been updated to the 2022/2023 academic year and new tables have been created in constant dollars to explore the evolution of tuition fees over time for both Canadian and international students.
Inflation is rising in most sectors and across all provinces and territories in Canada. From April 2021 to April 2022, the Canadian Consumer Price Index (CPI) showed an increase of 6.8%. This inflationary pressure affects various sectors and many socioeconomic groups differently. The purchasing power of postsecondary students is more likely to be affected, since their main spending is on food, rent and tuition.
Prices for groceries continue to increase, with Canadians paying 9.7% more for food purchases between April 2021 and April 2022, representing the largest increase since September 1981. A recent release showed that shelter costs had also risen at the fastest pace since 1983. Rent prices increased in the most populous provinces: Ontario (+5.3%), Quebec (+4.3%) and British Columbia (6.4%). These provinces also represent the highest enrolments in postsecondary education. The latest snapshot of the CPI 12-month change also shows that tuition fees increased in all provinces, ranging from an increase of 0.3% in Ontario to 5.7% in Alberta. According to the TLAC for 2021/2022, the increase in Alberta was because of a province-wide restructuring of tuition fees.
New data from the TLAC survey show that, in constant dollars to adjust for inflation, average tuition fees have been decreasing for Canadian students from 2018/2019 to 2022/2023. However, for international students, average tuition fees in constant dollars have continued to increase over time, especially for undergraduates. To further explore updated trends in tuition fees by field of study, different levels of study, and across provinces and territories, visit the new visualization tool "Elementary to Postsecondary Student Education Dashboard: Enrolments, Graduations and Tuition Fees."
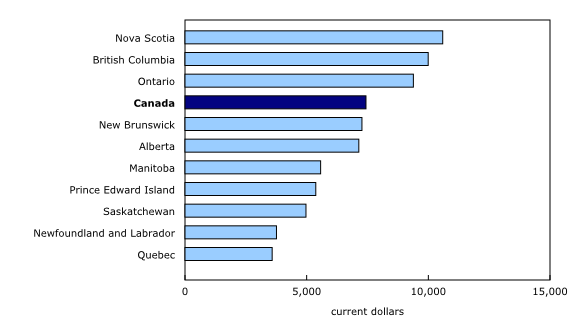
Nova Scotia, Ontario and British Columbia graduate students pay the highest tuition fees
Because the cost of education in Canada falls almost entirely under provincial jurisdiction, tuition fees for full-time postsecondary students vary across provinces. At the national level, full-time graduate students will pay, on average, $7,437 for the 2022/2023 academic year, whereas undergraduate students will pay $6,834. This represents a 1.7% and 2.6% increase, respectively, from the previous year.
In 2022/2023, graduate students in Nova Scotia will pay $10,591, representing 42.4% more than the Canadian average. Similarly, in Ontario ($9,385) and British Columbia ($9,994), graduate students will pay 26.2% and 34.4% above the average, respectively. On the other hand, tuition fees in Newfoundland and Labrador ($3,759) and Quebec ($3,582) are the lowest in Canada, at 49.5% and 51.8%, respectively, below the national average.
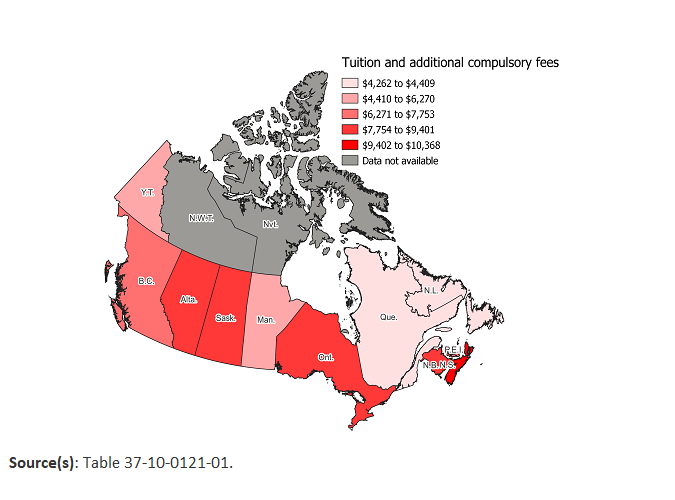
Tuition fees for undergraduate students also vary across provinces. Like graduate students, undergraduates in Nova Scotia will face the highest tuition fees at $9,328, 36.5% higher than the Canadian average. An additional five provinces are above the national average, and the relative difference ranges from 29.6% in Saskatchewan to 3.6% in Prince Edward Island.
Significant differences in tuition fees by level and field of study
In 2022/2023, Canadian graduate students will pay the highest tuition fees for executive Master of Business Administration (MBA) ($53,227) and regular MBA ($30,464) programs. Full-time graduate students in business, management and public administration ($14,823) and dentistry ($13,223) will also face higher tuition fees, followed by students in mathematics, computer and information sciences ($8,902), and engineering ($7,454). The tuition fees for these four fields are all above the national average cost for graduate programs, which rose to $7,437 (+1.7%) in 2022/2023.
During the same period, Canadian undergraduate students in the following six professional degree programs will pay the highest average tuition fees: dentistry ($23,963), medicine ($15,182), veterinary medicine ($14,838), law ($13,222), pharmacy ($12,291), and optometry ($10,389). Based on data from the Postsecondary Student Information System, these six programs account for, on average, 3.7% of all Canadian undergraduate student enrolments each year. Other undergraduate programs that will also face higher tuition fees than the national average ($6,834) in 2022/2023 include engineering ($8,527); business, management and public administration ($7,207); and mathematics, computer and information sciences ($7,012).
The decision to pay higher tuition fees for a given field of study can be influenced by potential employment opportunities and future expected returns. For instance, for the 2015 cohort, the interactive tool on labour market outcomes for college and university graduates shows that doctoral degrees in business, management and public administration had the highest median employment income ($109,600) five years after graduation. The same source also shows that professional degrees tended to have a higher median employment income ($101,600) compared with other fields of study.
The difference in tuition fees also varies by the level of study. Full-time graduate students in business, management and public administration will pay 105.7% more than their undergraduate counterparts. Similarly, graduate students in education will pay, on average, 30.8% more than undergraduate students. These higher fees, which tend to increase with the level of study, are in line with the expected return incentives. According to a recent study on labour market outcomes for college and university graduates, 2010 to 2015 cohort, master's degree graduates earned one-third more on average than undergraduates. This was particularly pronounced in the fields of education (58.0%), and business, management and public administration (45.0%).
Alberta has the highest additional compulsory fees
Additional compulsory fees are extra costs that students must pay in addition to tuition fees. They apply to all Canadian students regardless of field of study and can cover student health services, student associations and athletics fees.
Like tuition fees, additional compulsory fees also vary by province. In 2022/2023, Canadian undergraduate students in Alberta will pay the highest additional compulsory fees ($1,286), which are 23.8% above the Canadian average ($1,039). Undergraduate students in Yukon will pay the lowest additional compulsory fees ($390), which are 62.5% less than the Canadian average.
Alberta also has the highest additional compulsory fees for Canadian graduate students ($1,170), about 16.9% higher than the national average. Canadian graduate students tend to pay lower compulsory fees than their undergraduate counterparts, except in Prince Edward Island and Newfoundland and Labrador, where both levels of study pay similar fees.
The tuition fee gap between international and Canadian students continues to widen
According to a recent Postsecondary Student Information System release, the number of international students is rising, especially for colleges. From 2015/2016 to 2019/2020, the number of international college students increased by 154.0%, whereas the number of international university students increased by 39.6% over the same period. Almost one-third of international students enrolled in business, management, and public administration during the academic year of 2019/2020.
Nationally, in 2022/2023, international undergraduate students will pay $36,123 on average, about an 8.0% increase from the previous period. Similar to Canadian students, international students will pay higher tuition fees for veterinary medicine ($68,256), dentistry ($59,515) and medicine ($58,790) programs.
During the same period, the average tuition fees for international graduate students will be $21,111, representing a 4.3% increase compared with the previous period. Tuition fees for executive MBA ($76,687) and regular MBA ($41,767) programs continue to be among the highest.
Average tuition fees for international graduate ($27,149) and undergraduate ($45,242) programs are the highest in Ontario. Conversely, Newfoundland and Labrador has the lowest average tuition fees for international undergraduate ($16,786) and graduate ($5,327) students.
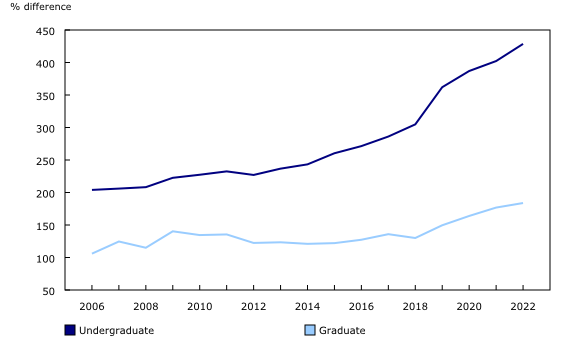
Overall, international students pay higher tuition fees than Canadian students. However, the gap differs by level of study and tends to widen over time. The tuition fee gap between Canadian and international students is higher for undergraduate students than graduate students, and this gap has increased substantially over time. In 2006/2007, international graduate students paid 106.0% more than Canadian students, whereas undergraduate students paid 204.0% more. The gap has widened over the years. In 2022/2023, international undergraduate students will pay 429.0% more than Canadian students, while international graduate students will pay 184.0% more.
The rising number of international students, combined with the higher tuition fees they pay compared with Canadian students, has contributed to the increase in the share of tuition fee revenues of Canadian universities versus provincial funding. According to Financial Information of Universities, the proportion of tuition revenues increased from 21.5% to 28.8% between 2010/2011 and 2020/2021, while provincial funding declined from 41.5% to 32.5%. According to preliminary estimates from the same survey, tuition fees from international students accounted for 37% of the tuition fees received by Canadians universities in 2019/2020. This trend may be related to a shift towards greater reliance on tuition fees from international students.
Note to readers
Data presented in this release are from the annual Tuition and living accommodation costs for full-time students at Canadian degree-granting institutions (TLAC) survey. The survey covers all public degree-granting institutions (universities and colleges) in Canada; that is, institutions that offer programs leading to degrees as defined by the Canadian Information Centre for International Credentials: bachelor's degrees, applied (bachelor's) degrees, applied master's degrees, master's degrees, and doctoral degrees. These degrees are more commonly offered by universities but may also be offered by colleges. Canadian students, including Canadian citizens and permanent residents, are reported separately from international students.
The TLAC survey was administered from May to July 2022 and data cover the 2022/2023 academic year. Data for 2022/2023 are preliminary. Any required changes will be applied to the 2023/2024 data release when the 2022/2023 data become final.
Although provincial policies generally regulate tuition fee increases, some programs may be exempt from these policies, resulting in possible rises that exceed provincial limits. Tuition fee averages may vary yearly because of changes in the program structures and fees.
National and provincial tuition fee averages are weighted with 2019/2020 student enrolments from the Postsecondary Student Information System. The same student enrolment figures are used for weighting both academic years (2021/2022 and 2022/2023), thereby allowing for a comparison of changes in tuition fees. If the number of enrolments for a given program is unknown, that program is excluded from the averages.
Master of Business Administration programs have been excluded from the national and provincial weighted averages to eliminate the effect of the high cost of these programs on the overall tuition fee averages. Dental, medical, and veterinary residency programs offered in teaching hospitals and other locations that may lead to advanced professional certification have also been excluded.
Because the distribution of enrolments across the various programs varies from period to period, caution must be exercised when making long-term historical comparisons.
Figures on enrolments are from the 2019/2020 Postsecondary Student Information System.
The fields of study are adapted from the 2016 Classification of Instructional Programs, Statistics Canada's standard for classifying instructional programs.
Data in this release do not consider financial assistance or tax rebates provided to students.
Products
To further explore 2022/2023 tuition fees for degree programs in a visual format, refer to the comprehensive data visualization tool "Elementary to Postsecondary Student Education Dashboard: Enrolments, Graduations and Tuition Fees".
This new comprehensive data visualization tool combines information from three surveys: Tuition and Living Accommodation Costs, Elementary-Secondary Education Survey, and the Postsecondary Student Information System. Each survey is released separately, and information includes the cost of tuition, an overview of total enrolment and graduation counts, characteristics of students and programs, and details on new enrolments by gender, age group and student status. The releases of the two other surveys are planned for later this year.
Contact information
For more information, or to enquire about the concepts, methods or data quality of this release, contact us (toll-free 1-800-263-1136; 514-283-8300; infostats@statcan.gc.ca) or Media Relations (statcan.mediahotline-ligneinfomedias.statcan@statcan.gc.ca).
- Date modified:


