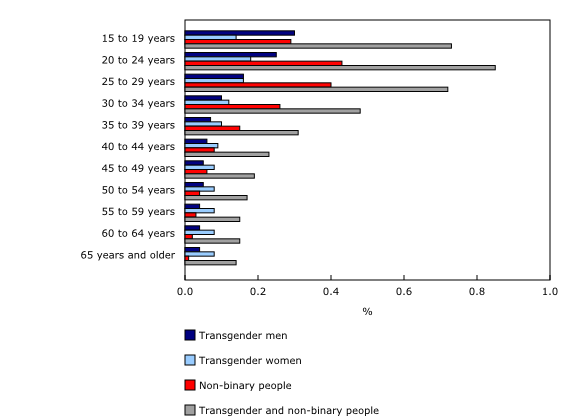
Chart 2
Gender diversity is highest among 20- to 24-year-olds

Source(s):
Census of Population, 2021 (3901).
Chart description
This is a bar clustered chart.
| Transgender men | Transgender women | Non-binary people | Transgender and non-binary people | |
|---|---|---|---|---|
| 15 to 19 years | 0.30 | 0.14 | 0.29 | 0.73 |
| 20 to 24 years | 0.25 | 0.18 | 0.43 | 0.85 |
| 25 to 29 years | 0.16 | 0.16 | 0.40 | 0.72 |
| 30 to 34 years | 0.10 | 0.12 | 0.26 | 0.48 |
| 35 to 39 years | 0.07 | 0.10 | 0.15 | 0.31 |
| 40 to 44 years | 0.06 | 0.09 | 0.08 | 0.23 |
| 45 to 49 years | 0.05 | 0.08 | 0.06 | 0.19 |
| 50 to 54 years | 0.05 | 0.08 | 0.04 | 0.17 |
| 55 to 59 years | 0.04 | 0.08 | 0.03 | 0.15 |
| 60 to 64 years | 0.04 | 0.08 | 0.02 | 0.15 |
| 65 years and older | 0.04 | 0.08 | 0.01 | 0.14 |
Source(s):
Census of Population, 2021 (3901).
- Date modified: