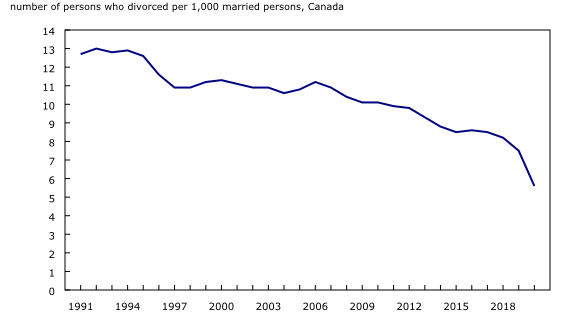
Chart 1
Steady decline of the divorce rate since 1991

Source(s):
Canadian Vital Statistics – Divorce Database (3235), table 39-10-0051-01.
Chart description
This is a line chart.
| number of persons who divorced per 1,000 married persons, Canada | |
|---|---|
| 1991 | 12.7 |
| 1992 | 13.0 |
| 1993 | 12.8 |
| 1994 | 12.9 |
| 1995 | 12.6 |
| 1996 | 11.6 |
| 1997 | 10.9 |
| 1998 | 10.9 |
| 1999 | 11.2 |
| 2000 | 11.3 |
| 2001 | 11.1 |
| 2002 | 10.9 |
| 2003 | 10.9 |
| 2004 | 10.6 |
| 2005 | 10.8 |
| 2006 | 11.2 |
| 2007 | 10.9 |
| 2008 | 10.4 |
| 2009 | 10.1 |
| 2010 | 10.1 |
| 2011 | 9.9 |
| 2012 | 9.8 |
| 2013 | 9.3 |
| 2014 | 8.8 |
| 2015 | 8.5 |
| 2016 | 8.6 |
| 2017 | 8.5 |
| 2018 | 8.2 |
| 2019 | 7.5 |
| 2020 | 5.6 |
Source(s):
Canadian Vital Statistics – Divorce Database (3235), table 39-10-0051-01.
- Date modified: