Infographic 1
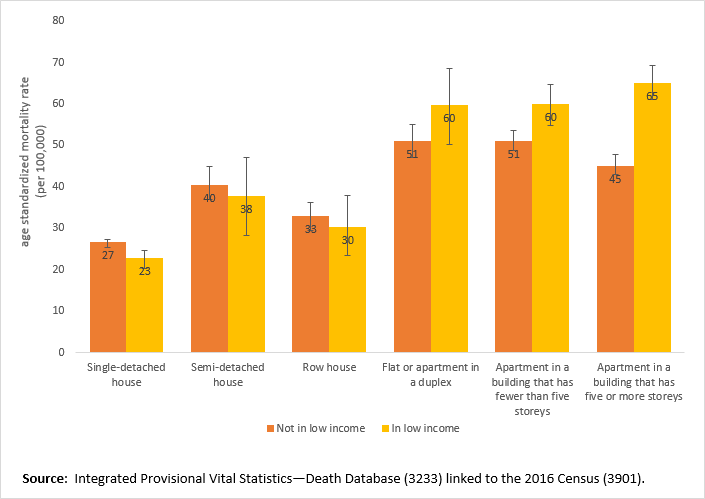
Age-standardized COVID-19 mortality rates in Canada between January 1, 2020 and March 31, 2021, by private dwelling type and household low income status (low income measure – after tax) in 2016

Infographic description
The title of the infographic is "Age-standardized COVID-19 mortality rates in Canada between January 1, 2020 and March 31, 2021, by private dwelling type and household low income status (low income measure – after tax) in 2016"
This is a bar chart with a y-axis and x-axis.
The y-axis represents the age-standardized COVID-19 mortality rates in Canada per 100,000 population, with values ranging from 0 to 80 with increments of 10.
The x-axis represents six orange and six yellow bars, arranged consecutively side by side. The orange bars represent not in low income group, while the yellow bars represent low income group. The six x-axis bars represent six dwelling types for each income group. The six private dwelling types from left to right are single-detached houses, semi-detached houses, row house, flat or apartment in a duplex, apartment in a building that has fewer than five storeys, and apartments in a building that has five or more storeys.
The bar chart shows that people who were in a low income household and lived in an apartment in a multi-storey building had significantly higher COVID-19 mortality rates in comparison to people who lived in other types of dwellings. The COVID-19 mortality rates for people living in a detached house, semi-detached house, row house or duplex did not differ based on low income status.
Age-standardized COVID-19 mortality rates for those not in low income and living in single-detached houses was 27 per 100,000 population, with 95% confidence intervals ranging between 26 and 28 per 100,000 population.
Age-standardized COVID-19 mortality rates for those in low income and living in single-detached houses was 23 per 100,000 population, with 95% confidence intervals ranging between 21 and 25 per 100,000 population.
Age-standardized COVID-19 mortality rates for those not in low income and living in semi-detached houses was 40 per 100,000 population, with 95% confidence intervals ranging between 37 and 44 per 100,000 population.
Age-standardized COVID-19 mortality rates for those in low income and living in semi-detached houses was 38 per 100,000 population, with 95% confidence intervals ranging between 28 and 47 per 100,000 population.
Age-standardized COVID-19 mortality rates for those not in low income and living in row houses was 33 per 100,000 population, with 95% confidence intervals ranging between 30 and 36 per 100,000 population.
Age-standardized COVID-19 mortality rates for those in low income and living in row houses was 30 per 100,000 population, with 95% confidence intervals ranging between 23 and 38 per 100,000 population.
Age-standardized COVID-19 mortality rates for those not in low income and living in flat or apartment in a duplex was 51 per 100,000 population, with 95% confidence intervals ranging between 47 and 55 per 100,000 population.
Age-standardized COVID-19 mortality rates for those in low income and living in flat or apartment in a duplex was 60 per 100,000 population, with 95% confidence intervals ranging between 51 and 69 per 100,000 population.
Age-standardized COVID-19 mortality rates for those not in low income and living in apartment in a building that has fewer than five storeys was 51 per 100,000 population, with 95% confidence intervals ranging between 49 and 54 per 100,000 population.
Age-standardized COVID-19 mortality rates for those in low income and living in apartment in a building that has fewer than five storeys was 60 per 100,000 population, with 95% confidence intervals ranging between 56 and 64 per 100,000 population.
Age-standardized COVID-19 mortality rates for those not in low income and living in apartments in a building that has five or more storeys was 45 per 100,000 population, with 95% confidence intervals ranging between 43 and 48 per 100,000 population.
Age-standardized COVID-19 mortality rates for those in low income and living in apartments in a building that has five or more storeys was 65 per 100,000 population, with 95% confidence intervals ranging between 60 and 70 per 100,000 population.
Source: Integrated Provisional Vital Statistics—Death Database (3233) linked to the 2016 Census of Population (3901).
- Date modified: