
Chart 2
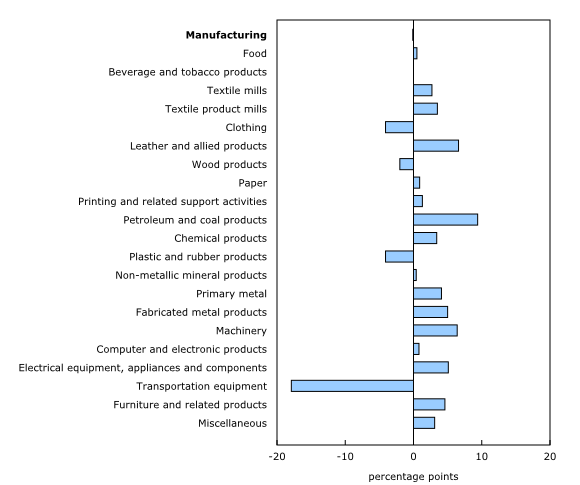
Year-over-year change by industry, third quarter 2021 compared with third quarter 2020
Source(s):
Table 16-10-0109-01.
Chart description
This is a bar clustered chart.
| percentage points | |
|---|---|
| Manufacturing | -0.1 |
| Food | 0.5 |
| Beverage and tobacco products | 0.0 |
| Textile mills | 2.7 |
| Textile product mills | 3.5 |
| Clothing | -4.1 |
| Leather and allied products | 6.6 |
| Wood products | -2.0 |
| Paper | 0.9 |
| Printing and related support activities | 1.3 |
| Petroleum and coal products | 9.4 |
| Chemical products | 3.4 |
| Plastic and rubber products | -4.1 |
| Non-metallic mineral products | 0.4 |
| Primary metal | 4.1 |
| Fabricated metal products | 5.0 |
| Machinery | 6.4 |
| Computer and electronic products | 0.8 |
| Electrical equipment, appliances and components | 5.1 |
| Transportation equipment | -17.9 |
| Furniture and related products | 4.6 |
| Miscellaneous | 3.1 |
Source(s):
Table 16-10-0109-01.
- Date modified: