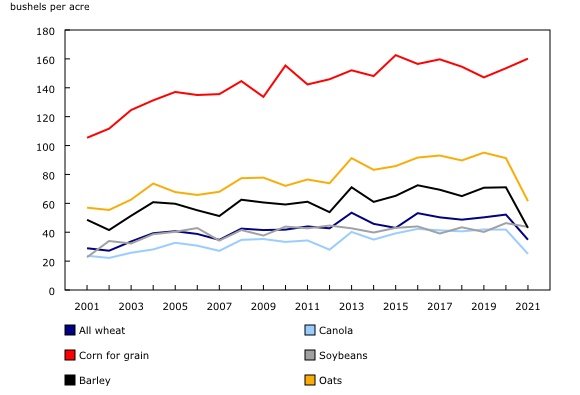
Chart 1
National yield of selected field crops

Source(s):
Table 32-10-0359-01.
Chart description
This is a line chart.
| All wheat | Canola | Corn for grain | Soybeans | Barley | Oats | |
|---|---|---|---|---|---|---|
| 2001 | 28.9 | 23.7 | 105.4 | 22.7 | 48.6 | 57.0 |
| 2002 | 27.2 | 22.2 | 111.7 | 33.9 | 41.5 | 55.4 |
| 2003 | 33.6 | 25.8 | 124.6 | 32.2 | 51.4 | 62.6 |
| 2004 | 39.3 | 28.1 | 131.3 | 38.6 | 60.8 | 73.7 |
| 2005 | 40.7 | 32.7 | 137.1 | 40.3 | 59.7 | 67.8 |
| 2006 | 38.8 | 30.7 | 135.0 | 42.9 | 55.2 | 65.8 |
| 2007 | 34.7 | 27.1 | 135.6 | 34.2 | 51.2 | 68.0 |
| 2008 | 42.5 | 34.7 | 144.6 | 41.5 | 62.5 | 77.4 |
| 2009 | 41.5 | 35.3 | 133.7 | 37.7 | 60.6 | 77.8 |
| 2010 | 41.8 | 33.3 | 155.4 | 43.9 | 59.2 | 72.1 |
| 2011 | 44.0 | 34.3 | 142.3 | 42.7 | 61.1 | 76.5 |
| 2012 | 42.7 | 27.9 | 145.9 | 44.6 | 53.9 | 73.9 |
| 2013 | 53.5 | 40.2 | 152.1 | 42.7 | 71.1 | 91.3 |
| 2014 | 45.8 | 34.9 | 148.1 | 39.8 | 61.0 | 83.2 |
| 2015 | 43.0 | 39.2 | 162.6 | 43.0 | 65.2 | 85.8 |
| 2016 | 53.2 | 42.3 | 156.5 | 44.0 | 72.5 | 91.7 |
| 2017 | 50.3 | 41.3 | 159.7 | 39.1 | 69.4 | 93.1 |
| 2018 | 48.7 | 40.6 | 154.6 | 43.4 | 65.0 | 89.7 |
| 2019 | 50.3 | 41.9 | 147.2 | 40.2 | 70.8 | 95.1 |
| 2020 | 52.2 | 41.8 | 153.5 | 46.3 | 71.1 | 91.3 |
| 2021 | 34.8 | 25.0 | 160.2 | 43.7 | 43.0 | 61.5 |
Source(s):
Table 32-10-0359-01.
- Date modified: