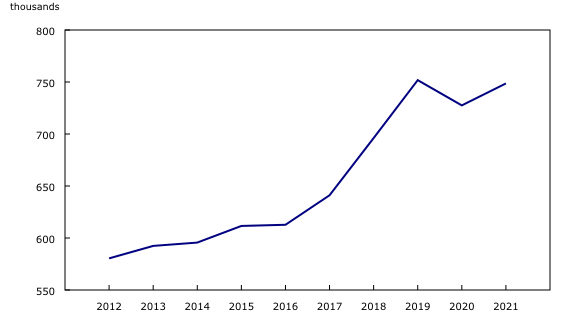
Chart 8
Number of very recent immigrants in Canada's labour force stalls during COVID

Note(s):
The estimate for 2021 is the average of monthly estimates from January to July 2021.
Source(s):
Labour Force Survey (3701), table 14-10-0083-01 and custom tabulation.
Chart description
This is a line chart.
| thousands | |
|---|---|
| 2012 | 580.4 |
| 2013 | 592.4 |
| 2014 | 595.6 |
| 2015 | 611.6 |
| 2016 | 612.7 |
| 2017 | 641.1 |
| 2018 | 696.1 |
| 2019 | 751.8 |
| 2020 | 727.5 |
| 2021 | 748.6 |
Note(s):
The estimate for 2021 is the average of monthly estimates from January to July 2021.
Source(s):
Labour Force Survey (3701), table 14-10-0083-01 and custom tabulation.
- Date modified: