
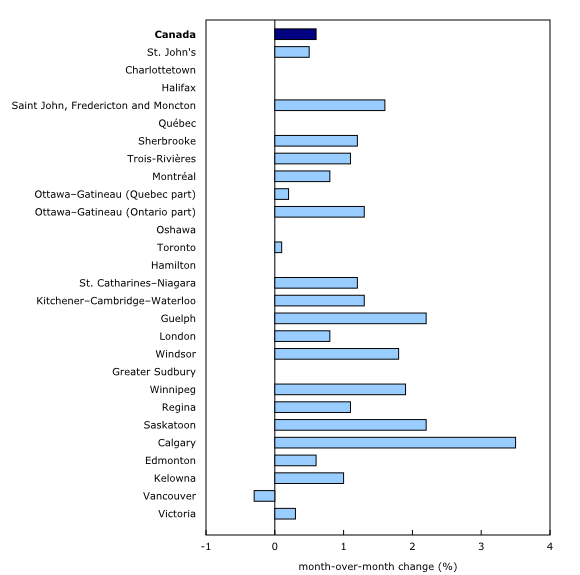
Chart 2
New house prices rise 0.6% at the national level
Source(s):
Table 18-10-0205-02.
Chart description
This is a bar clustered chart.
| month-over-month change (%) | |
|---|---|
| Canada | 0.6 |
| St. John's | 0.5 |
| Charlottetown | 0.0 |
| Halifax | 0.0 |
| Saint John, Fredericton and Moncton | 1.6 |
| Québec | 0.0 |
| Sherbrooke | 1.2 |
| Trois-Rivières | 1.1 |
| Montréal | 0.8 |
| Ottawa–Gatineau (Quebec part) | 0.2 |
| Ottawa–Gatineau (Ontario part) | 1.3 |
| Oshawa | 0.0 |
| Toronto | 0.1 |
| Hamilton | 0.0 |
| St. Catharines–Niagara | 1.2 |
| Kitchener–Cambridge–Waterloo | 1.3 |
| Guelph | 2.2 |
| London | 0.8 |
| Windsor | 1.8 |
| Greater Sudbury | 0.0 |
| Winnipeg | 1.9 |
| Regina | 1.1 |
| Saskatoon | 2.2 |
| Calgary | 3.5 |
| Edmonton | 0.6 |
| Kelowna | 1.0 |
| Vancouver | -0.3 |
| Victoria | 0.3 |
Source(s):
Table 18-10-0205-02.
- Date modified: