Infrastructure Economic Account: Environmental perspective, 2020
Archived Content
Information identified as archived is provided for reference, research or recordkeeping purposes. It is not subject to the Government of Canada Web Standards and has not been altered or updated since it was archived. Please "contact us" to request a format other than those available.
Released: 2021-06-22
The Infrastructure Economic Account has recently been expanded to include an environmental perspective, providing insight on the relationship between investment in infrastructure and the environment. Main indicators include greenhouse gas emissions caused by the production of infrastructure assets, greenhouse gas emissions per value added, and clean input proportion.
Total greenhouse gas emissions from the production of infrastructure assets have increased from a recent low in 2011, corresponding to the injection of infrastructure investment. However, the greenhouse gas emissions per value added has actually decreased since 2012 and remained stable from 2015 to 2020. A decrease of greenhouse gas emission per value added suggests that environmental improvements are made in the construction of these assets.
Variances in greenhouse gas emissions per value added occur as the production of certain infrastructure assets results in more emissions than others. In 2020, the intensity of greenhouse gas emissions for producing total infrastructure assets stood at 0.39 tonnes per value added. Among all infrastructure assets, the highest intensity was observed in other machinery and equipment (0.67 tonnes per value added) and transportation machinery and equipment (0.65 tonnes per value added). Because high greenhouse gas emissions are associated with the manufacturing industry, the intensity for these two assets was well above the average. The next-highest greenhouse gas emissions intensity was in oil and gas engineering construction at 0.43 tonnes per value added, and the lowest was in electric power infrastructure at 0.36 tonnes per value added.
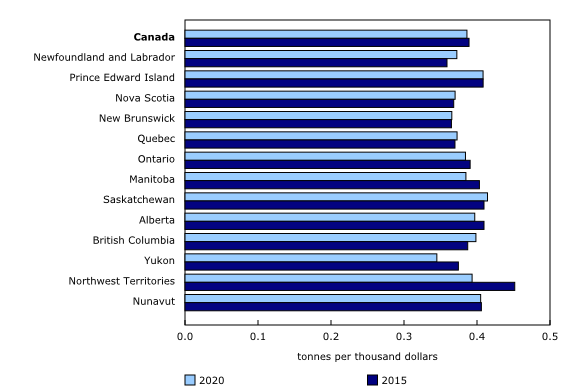
As different assets have different levels of greenhouse gas emissions intensity, the greenhouse gas emissions to value added indicator for infrastructure assets will vary based on the significance of each asset within each region. In 2020, there were small differences in the level of emissions per value added among regions, ranging from a high of over 0.40 tonnes per value added in Prince Edward Island, Saskatchewan, Alberta and Nunavut, to a low of just below 0.35 tonnes in Yukon.
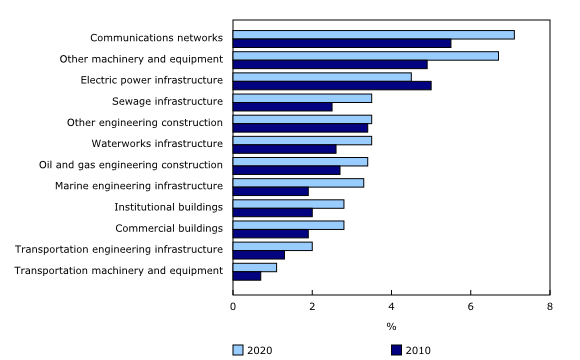
Over the time period of 2010 to 2020, the proportion of inputs used in the production of infrastructure assets considered to be environmental and clean technology products was low, but it rose from 2.7% in 2010 to 3.3% in 2020. The percentage of infrastructure investment that was considered "clean" in 2020 was 0.3 percentage points higher than the proportion in the entire economy from the Environmental and Clean Technology Products Economic Account estimates in 2019.
Similar to greenhouse gas emissions to value added, the proportions of "clean" inputs vary among different infrastructure assets and change over time. In 2020, the proportion of "clean" inputs increased from 2010 in all groups of infrastructure assets, with the exception of electric power infrastructure. At the group level, the communication networks assets had the highest proportion of "clean" inputs at 7.1% in 2020, while the transportation machinery and equipment assets have the lowest proportion at 1.1%.
Note to readers
The Environmental Perspective of the Infrastructure Economic Account complements and enhances the analytical capacity already available in the account. By linking two sets of environmental accounts to the Infrastructure Economic Account, a better understanding is gained of the relationship between economic activity and the environment. The first set of accounts, the Physical Flow Accounts, measures greenhouse gas emissions resulting from economic activity. The second set of accounts, the Environmental and Clean Technology Products Economic Account, measures the production and use of goods and services that reduce the negative environmental impacts associated with economic activity.
The Physical Flow Accounts record the greenhouse gas emissions associated with an industry's output and the Infrastructure Economic Account isolates the production of infrastructure assets by producing industry. This economic activity was linked to the Physical Flow Accounts, on an industry basis, to determine the greenhouse gas emissions resulting from the production of infrastructure assets.
Additionally, by linking the Environmental and Clean Technology Products Economic Account to the Infrastructure Economic Account, using the input structure of the Supply-Use tables, the amount of inputs used in the construction of infrastructure considered to be environmental and clean technology products were determined. In general, if infrastructure investment increases, so will the amount that is "clean." However, a ratio of these inputs over time can help determine if infrastructure assets are using "cleaner" inputs in their overall design.
The combination of the Infrastructure Economic Account, the Physical Flow Accounts and Environmental and the Clean Technology Products Economic Account provides a variety of indicators that can aid in understanding the relationship between investment in infrastructure and the environment. The main indicators include greenhouse gas emissions resulting from the production of infrastructure assets, greenhouse gas emissions per value added, and clean input proportion.
Products
The Infrastructure Economic Account section, which is part of the Methodological Guide: Canadian System of Macroeconomic Accounts (13-607-X), is available.
The publication Clean technologies and the Survey of Environmental Goods and Services: A technical reference guide (16-511-X) is available.
The productPhysical flow account for greenhouse gas emissions: Interactive tool (71-607-X) is available.
The Latest Developments in the Canadian Economic Accounts (13-605-X) is available.
The User Guide: Canadian System of Macroeconomic Accounts (13-606-G) is available.
Contact information
For more information, or to enquire about the concepts, methods or data quality of this release, contact us (toll-free 1-800-263-1136; 514-283-8300; STATCAN.infostats-infostats.STATCAN@canada.ca) or Media Relations (613-951-4636; STATCAN.mediahotline-ligneinfomedias.STATCAN@canada.ca).
- Date modified:


