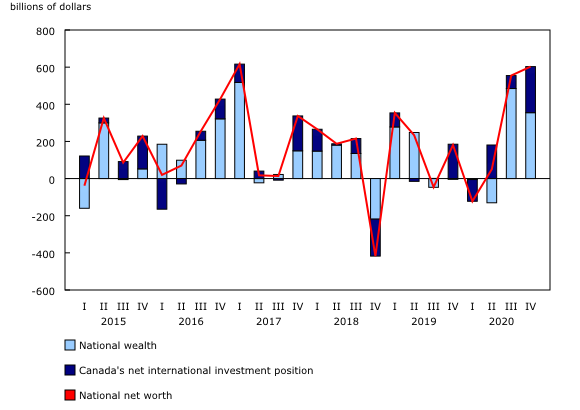
Chart 1
Change in national net worth by component

Source(s):
Table 36-10-0580-01.
Chart description
This is a combined line chart.
| National wealth | Canada's net international investment position | National net worth | |
|---|---|---|---|
| First quarter 2015 | -159.9 | 121.6 | -38.3 |
| Second quarter 2015 | 299.9 | 25.9 | 325.9 |
| Third quarter 2015 | -5.5 | 91.5 | 86.0 |
| Fourth quarter 2015 | 52.2 | 176.6 | 228.8 |
| First quarter 2016 | 184.8 | -164.9 | 19.8 |
| Second quarter 2016 | 98.8 | -28.9 | 70.0 |
| Third quarter 2016 | 206.5 | 48.3 | 254.9 |
| Fourth quarter 2016 | 321.6 | 106.4 | 427.9 |
| First quarter 2017 | 517.6 | 98.7 | 616.3 |
| Second quarter 2017 | -22.9 | 40.3 | 17.4 |
| Third quarter 2017 | 22.1 | -8.5 | 13.6 |
| Fourth quarter 2017 | 149.5 | 187.7 | 337.2 |
| First quarter 2018 | 148.0 | 117.5 | 265.6 |
| Second quarter 2018 | 180.2 | 7.2 | 187.4 |
| Third quarter 2018 | 135.4 | 80.0 | 215.5 |
| Fourth quarter 2018 | -218.6 | -198.8 | -417.4 |
| First quarter 2019 | 278.1 | 75.5 | 353.6 |
| Second quarter 2019 | 248.1 | -14.9 | 233.2 |
| Third quarter 2019 | -47.0 | 0.9 | -46.1 |
| Fourth quarter 2019 | -4.2 | 184.9 | 180.7 |
| First quarter 2020 | -5.5 | -116.8 | -122.3 |
| Second quarter 2020 | -130.4 | 180.7 | 50.3 |
| Third quarter 2020 | 484.8 | 69.8 | 554.6 |
| Fourth quarter 2020 | 354.8 | 248.1 | 602.8 |
Source(s):
Table 36-10-0580-01.
- Date modified: