Quarterly financial statistics for enterprises, fourth quarter 2020
Archived Content
Information identified as archived is provided for reference, research or recordkeeping purposes. It is not subject to the Government of Canada Web Standards and has not been altered or updated since it was archived. Please "contact us" to request a format other than those available.
Released: 2021-02-24
$82.5 billion
Fourth quarter 2020
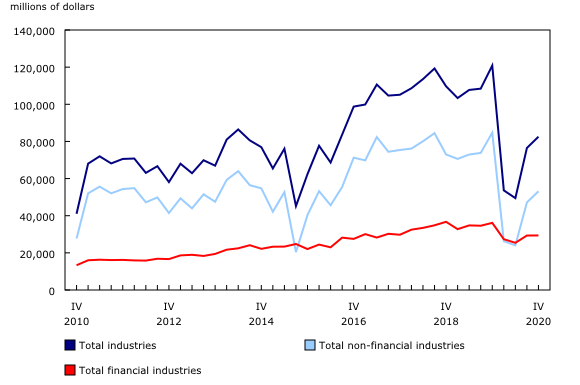
In the fourth quarter, Canadian corporations reported a 7.9% increase in net income before taxes to $82.5 billion, a growth of $6.1 billion. Operating revenues rose 1.8% to $1,080.4 billion during the quarter.
Net income before taxes in the non-financial sector increases
Net income before taxes in the non-financial sector increased by 12.8% (or $6.0 billion) to $53.2 billion in the fourth quarter.
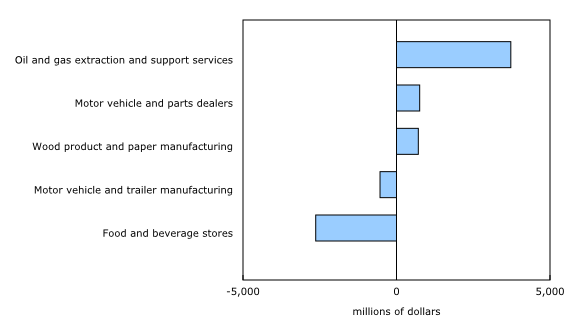
Net income before taxes in oil and gas extraction and support activities increased by $3.7 billion (+56.5%) in the fourth quarter. This increase is attributable to higher oil prices and volumes for the quarter. Nonetheless, the industry reported losses for a fourth consecutive quarter, recording a loss of $2.9 billion in the fourth quarter. This was an improvement from the loss of $6.6 billion in the third quarter.
Manufacturing net income before taxes edges down
Net income before taxes in the manufacturing industry edged down by $120 million (-0.9%), reaching $12.6 billion in the fourth quarter.
Petroleum and coal manufacturing led the decrease in net income before taxes, down $870 (-187.1%) million as expenses related to asset revaluations increased in the fourth quarter.
Net income before taxes in motor vehicle and trailer manufacturing decreased by $536 million (-45.8%) as revenues were down this quarter. Exports of motor vehicles and parts decreased by 9.9% in the fourth quarter.
Mostly offsetting these decreases in net income before taxes for the manufacturing industry was wood and paper manufacturing, which rose by $711 million (+32.4%), on increased prices and robust demand in the panels segment of the industry.
Retail trade sector net income before taxes decreases
Net income before taxes in the retail trade sector decreased (-17.8%, or -$776 million) to $3.6 billion.
The food and beverage stores industry led the decrease in net income before taxes, down $2.6 billion (-187.8%) on lower revenues.
Motor vehicles and parts dealers recorded an increase in net income before taxes (+$755 million, or +126.9%).
Financial sector net income before taxes edges up
Net income before taxes for financial corporations edged up 0.1% (+$37 million) to $29.4 billion in the fourth quarter.
Life, health and medical insurance carriers led the increase, up $873 million (+56.2%) because of higher premium revenues.
The banking and depository credit intermediation industry saw continued growth from the prior quarter, with net income before taxes reaching $9.5 billion in the fourth quarter—a rise of 6.2% (+$553 million).
Mostly offsetting those increases in net income before taxes for the financial sector were the property and casualty insurance carriers that decreased by $1.4 billion (-50.7%) in the fourth quarter.
Note to readers
Data from the Quarterly Survey of Financial Statements (QSFS) include amounts from government programs that support business, such as the Canada Emergency Wage Subsidy. These amounts are considered to be revenue for these businesses.
However, with response rates lower than historical averages; the potential delay in the release of this information by businesses; and the methodology used to calculate QSFS estimates, use of these government support programs may be underestimated in the published data.
Data on quarterly net income before taxes in this release are seasonally adjusted and expressed in current dollars, unless otherwise stated.
For information on seasonal adjustment, see Seasonally adjusted data – Frequently asked questions.
Quarterly financial statistics for enterprises are based on a sample survey and represent the activities of all corporations in Canada, except those that are government-controlled or not-for-profit. The survey collects data on balance sheets, income statements and additional disclosures of enterprises.
An enterprise can be a single corporation or a family of corporations under common ownership or control, for which consolidated financial statements are produced.
Survey changes
The following changes were introduced to the survey starting with the first quarter of 2020:
- New content was implemented in the first quarter to align the survey to new accounting standards adopted by corporations starting in 2011.
- New industrial breakdowns were implemented, allowing for more granularity in the dissemination of data, were implemented. As a result, some industry groupings were merged, others were split and some remained the same.
- The survey's sample was modified to support the new industrial breakdowns; however, a maximum sample overlap with the previous sample was adopted.
- A more automated imputation strategy was implemented to streamline the process and to reduce the need for manual intervention.
Analytical focus change
Up to the fourth quarter of 2019, the QSFS focused primarily on operating profit/losses to track the financial performance of enterprises. An enterprise earns operating profits from its core business operations and is the difference between operating revenues and operating expenses.
The content for the QSFS questionnaire, up until the fourth quarter of 2019, did not include a distinction between operating revenues and expenses. To calculate the operating profit of an enterprise, additional information on expenses—particularly cost of goods sold—was collected and included in the calculation.
Over time, the response rate for the cost of goods sold variable declined. Accounts used by financial industries and non-financial industries differed due to the nature of their activity, with some enterprises no longer reporting operating profits in their financial statements.
Changes to accounting standards in 2006 (new financial instruments standards) and in 2011 (adoption of International Financial Reporting Standards) included the introduction of gains/losses in asset revaluations, which further complicated the calculation of operating profits.
Asking respondents to report categories of revenue and expenses, as well as a breakdown, within each of those two categories, between operating and non-operating amounts, would have increased response burden.
Being an economy-wide program, the QSFS requires a certain degree of comparability with the concepts used to assess financial performance across enterprises and industries.
To overcome some of the difficulties in terms of comparability at the operating profit level, and to avoid increased response burden, the focus of QSFS analysis will change—starting with the first quarter of 2020— from operating profit to net income before income taxes to better assess an enterprise's financial performance. Net income before income taxes is earned from normal business activities.
Net income before income taxes is a more inclusive measure and its calculations are more standardized between enterprises and industries.
Revisions, benchmarking and back-casting
The release of the QSFS in the fourth quarter 2020 includes revised estimates from the first, second and third quarter 2020.
Efforts are being made to back-cast these data to the first quarter of 2010 to allow for better historical comparisons. However, as more than one cycle of the new content is required before this exercise can begin, users are encouraged to be cautious when making historical comparisons.
It is expected that the back-casting work will be completed and results will be released at the end of 2021.
Larger-than-usual revisions may be anticipated in the future, as quarterly revisions, annual benchmarking, back casting and receipt of new survey data from respondents will be incorporated to improve data quality and include the most up-to-date data.
Business performance and ownership statistics portal
The Business performance and ownership statistics portal, accessible from the Subjects module of our website, provides users a single point of access to a wide variety of information related to business performance and ownership in Canada.
Next release
Financial statistics for enterprises for the first quarter of 2021 will be released on May 25, 2021.
Products
Aggregate balance sheet and income statement data for Canadian corporations are now available.
Data from the Quarterly Survey of Financial Statements are also available.
Contact information
For more information, or to enquire about the concepts, methods or data quality of this release, contact us (toll-free 1-800-263-1136; 514-283-8300; STATCAN.infostats-infostats.STATCAN@canada.ca) or Media Relations (613-951-4636; STATCAN.mediahotline-ligneinfomedias.STATCAN@canada.ca).
- Date modified:


