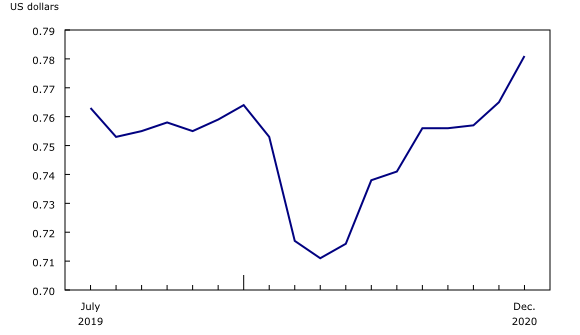
Chart 2
Monthly average of the Canadian dollar value in US dollars

Source(s):
Table 33-10-0163-01.
Chart description
This is a line chart.
| US dollars | |
|---|---|
| July 2019 | 0.763 |
| August 2019 | 0.753 |
| September 2019 | 0.755 |
| October 2019 | 0.758 |
| November 2019 | 0.755 |
| December 2019 | 0.759 |
| January 2020 | 0.764 |
| February 2020 | 0.753 |
| March 2020 | 0.717 |
| April 2020 | 0.711 |
| May 2020 | 0.716 |
| June 2020 | 0.738 |
| July 2020 | 0.741 |
| August 2020 | 0.756 |
| September 2020 | 0.756 |
| October 2020 | 0.757 |
| November 2020 | 0.765 |
| December 2020 | 0.781 |
Source(s):
Table 33-10-0163-01.
- Date modified: