Infographic 1
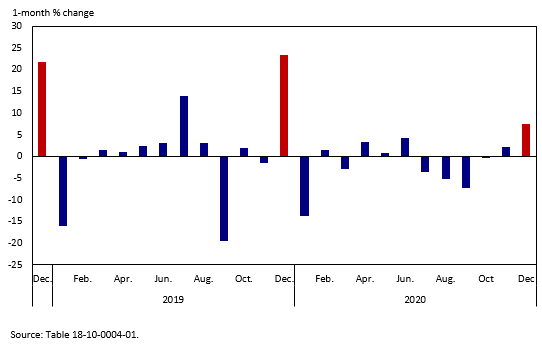
Monthly changes in air transportation prices

Infographic description
The title of the infographic is "Monthly changes in air transportation prices"
The title of the infographic is "Monthly changes in air transportation prices"
This is a bar chart.
The y axis represents the 1-month percentage change in the air transportation price index in Canada.
The y axis starts at -25% and goes to 30%, with increments of 5%.
The x axis represents the monthly periods in 2018 to 2020, and goes from January 2018 to December 2020, with increments of 1.
There is one series. The series represents the 1-month percentage change in the air transportation price index in Canada, spanning the period from January 2018 to December 2020.
At period January 2018, the series is at 3.3%.
At period February 2018, the series is at -0.3%.
At period March 2018, the series is at 2.9%.
At period April 2018, the series is at -2.8%.
At period May 2018, the series is at 0.3%.
At period June 2018, the series is at 5.0%.
At period July 2018, the series is at 16.4%.
At period August 2018, the series is at -2.2%.
At period September 2018, the series is at -16.6%.
At period October 2018, the series is at 4.6%.
At period November 2018, the series is at -2.3%.
At period December 2018, the series is at 21.7%.
At period January 2019, the series is at -16.0%.
At period February 2019, the series is at -0.6%.
At period March 2019, the series is at 1.6%.
At period April 2019, the series is at 1.1%.
At period May 2019, the series is at 2.4%.
At period June 2019, the series is at 3.0%.
At period July 2019, the series is at 14.0%.
At period August 2019, the series is at 3.2%.
At period September 2019, the series is at -19.5%.
At period October 2019, the series is at 1.9%.
At period November 2019, the series is at -1.5%.
At period December 2019, the series is at 23.4%.
At period January 2020, the series is at -13.8%.
At period February 2020, the series is at 1.5%.
At period March 2020, the series is at -2.9%.
At period April 2020, the series is at 3.4%.
At period May 2020, the series is at 0.7%.
At period June 2020, the series is at 4.3%.
At period July 2020, the series is at -3.6%.
At period August 2020, the series is at -5.1%.
At period September 2020, the series is at -7.3%.
At period October 2020, the series is at -0.4%.
At period November 2020, the series is at 2.2%.
At period December 2020, the series is at 7.4%.
There are three highlighted portions. The first highlighted portion is the air transportation price index monthly movement in December 2018 of 21.70%. The second highlighted portion is the air transportation price index monthly movement in December 2019 of 23.40%. The third highlighted portion is the air transportation price index monthly movement in December 2020 of 7.40%.
Source: Table 18-10-0004-01.
- Date modified: