
Chart 1
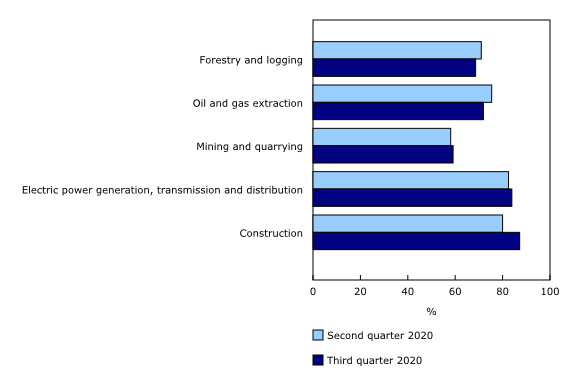
Industrial capacity utilization in non-manufacturing industries
Source(s):
Table 16-10-0109-01.
Chart description
This is a bar clustered chart.
| Second quarter 2020 | Third quarter 2020 | |
|---|---|---|
| Forestry and logging | 71.0 | 68.6 |
| Oil and gas extraction | 75.4 | 71.9 |
| Mining and quarrying | 58.1 | 59.1 |
| Electric power generation, transmission and distribution | 82.5 | 83.9 |
| Construction | 80.0 | 87.2 |
Source(s):
Table 16-10-0109-01.
- Date modified: