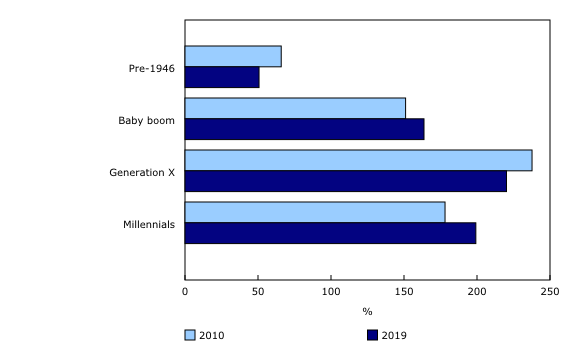
Chart 3
Debt-to-income ratio by generation, 2010 and 2019

Source(s):
Table 36-10-0589-01.
Chart description
This is a bar clustered chart.
| 2010 | 2019 | |
|---|---|---|
| Pre-1946 | 65.9 | 50.7 |
| Baby boom | 151.1 | 163.7 |
| Generation X | 237.7 | 220.2 |
| Millennials | 178.1 | 199.2 |
Source(s):
Table 36-10-0589-01.
- Date modified: