Gross domestic product by industry, August 2020
Archived Content
Information identified as archived is provided for reference, research or recordkeeping purposes. It is not subject to the Government of Canada Web Standards and has not been altered or updated since it was archived. Please "contact us" to request a format other than those available.
Released: 2020-10-30
August 2020
1.2% 
(monthly change)
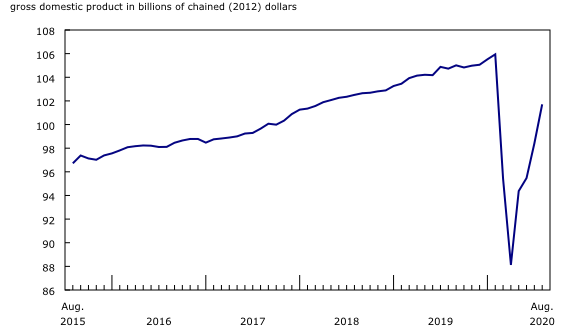
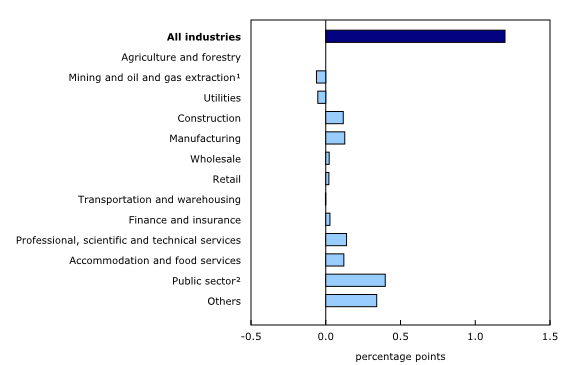
Real gross domestic product (GDP) grew 1.2% in August, following a 3.1% increase in July. This fourth consecutive monthly increase continued to offset the steepest drops on record in Canadian economic activity observed in March and April, however overall economic activity was still about 5% below February's pre-pandemic level.
Both goods-producing (+0.5%) and services-producing (+1.5%) industries were up as 15 of 20 industrial sectors posted increases and two were essentially unchanged in August.
Given the unprecedented economic situation brought on by the COVID-19 pandemic and the demand for trusted information, Statistics Canada continues to provide an advanced aggregate indicator of the state of the Canadian economy. Preliminary information indicates an approximate 0.7% increase in real GDP for September as the manufacturing, public, and mining, quarrying and oil and gas extraction sectors increased. This advanced estimate points to an approximate 10% increase in real GDP in the third quarter of 2020. Owing to their preliminary nature, these estimates will be revised on December 1 with official releases of GDP data for September and the third quarter.
The public sector continues to increase
The public sector (educational services, health care and social assistance, and public administration) grew 1.9% in August, as all three components were up. With record growth over the last four months, the public sector largely recouped the declines of March and April but was about 4% below February's pre-pandemic level.
The education sector rose 3.4% in August, led by a 5.1% increase in elementary and secondary schools. Continued effort by elementary and secondary school teachers, support staff, and administrators across the country to prepare classrooms for a return to school, with online learning, coupled with other COVID-19 related protocols (such as enhanced cleaning, preparing schools and classroom for physical distancing, etc.), partly contributed to an atypical August increase in an atypical year as educational services continue to recover from low spring levels.
The output of health care and social assistance rose 1.6%, as all forms of health and social care services grew. Ambulatory health care services (services provided by offices of physicians, health practitioners, dentists, and medical and diagnostic laboratories) were up 1.9%; however output was approximately 14% below its February pre-pandemic level. Many health care providers' offices continued to operate at a reduced capacity, including restricting the number of appointments aimed at limiting the spread of COVID-19. Nursing and residential care facilities (+1.8%) and social assistance (+3.8%) were also up, while hospitals increased 0.6%.
Public administration was up 1.2% in August, as output at all levels of government increased. Public administration facilities such as government services centres, courts, etc., continued to gradually reopen in-person locations as many regions across the country continued to ease emergency restrictions, while the majority of public servants continued performing their functions remotely.
Professional services grow
Professional services expanded 2.2% in August as all industries, except for specialized design services (-0.5%), were up. Contributing the most to the gains were other professional, scientific and technical services (+10.2%) and computer systems design and related services (+1.6%). Legal services, which derive much of their activity from real estate transactions, continued to grow in the month, up 2.9%.
Manufacturing continues to grow
The manufacturing sector was up for the fourth consecutive month, although at a much slower pace compared with the previous three months, rising 1.2% in August as gains in durable manufacturing more than offset lower non-durable manufacturing.
Durable manufacturing grew 3.8% in August as 8 of 10 subsectors increased. Contributing the most to the growth was the machinery manufacturing subsector (+9.4%) as the output of the majority of industries rose, influenced by higher inventory formation according to the Monthly Survey of Manufacturing. Miscellaneous manufacturing increased 17.3%, led by a 22.0% jump in medical equipment and supplies manufacturing. Wood products manufacturing grew 8.7% as all industries were up, benefiting from higher prices for their products driven by low supply following the onset of the COVID-19 pandemic and heightened demand both domestically and internationally. Transportation equipment expanded 1.6% as the majority of industries were up, while electrical equipment (-10.1%) and primary metal manufacturing (-0.2%) offset some of the gains.
Non-durable manufacturing contracted 1.6% in August as declines concentrated in plastic and rubber products (-11.1%), chemical (-2.4%), petroleum, coal products (-3.7%) and food manufacturing (-0.8%) more than offset gains in the remaining subsectors.
Strength in construction continues
The construction sector rose 1.5% in August, up for the fourth consecutive month, as the majority of subsectors increased, bringing the activity to within 2% of February's pre-pandemic level.
Residential construction grew 1.8% in August, surpassing the pre-pandemic level of activity as all types of residential construction were up. Both engineering and other construction (+2.7%) and repair construction (+1.5%) grew in August, while non-residential construction contracted 1.7% with all components down.
Real estate grows
Real estate and rental and leasing grew 0.8% in August following a 1.9% gain in July. After three months of double-digit increases, activity at the offices of real estate agents and brokers was up another 8.6% in August, reaching its highest level since the start of the series, buoyed by continued strong home resale activity across the country.
Accommodation and food services continue to expand
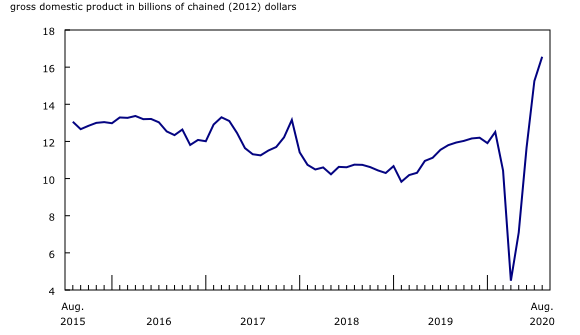
Following three months of double-digit increase, accommodation and food services rose 7.3% in August. Activity at food services and drinking places rose 5.6% as establishments continued to reopen and customers got used to new rules and restrictions. As reported by the Food Services and Drinking Places survey, activity grew across the country at all types of restaurants as well as bars, pubs and some nightclubs as summer and patio-season progressed.
Accommodation services grew 12.3% in August but was approximately 38% below February in light of the varying sets of rules for interprovincial travel and continued international travel restrictions.
Arts, entertainment and recreation sector grows
The arts, entertainment and recreation sector grew 13.7% as all components were up. Amusement, gambling and recreation industries contributed the most to the growth with a 17.2% increase as amusement parks, casinos and other establishments continued reopening across the country. Performing arts, spectator sports and related industries, and heritage institutions rose 7.4% in August. The National Hockey League restarted its 2019/2020 season in two Canadian hub cities, Edmonton and Toronto, with no attendance, while the Major League Soccer teams continued playing in empty or near-empty stadiums in Canada.
Other industries
The mining, quarrying, and oil and gas extraction sector decreased 1.7% in August as the majority of subsectors declined. Amid continued low global oil prices, oil and gas extraction decreased 3.9% in August, driven by a drop in oil sands extraction (-7.5%) which, outside of the Fort McMurray wildfire, is at a level last seen in September 2015 following the 2014 crash in oil prices. Mining and quarrying (except oil and gas) decreased 2.2% in August as a 21.7% drop in potash mining more than offset higher metal ore (+0.7%) and coal (+3.7%) mining. Support activities for mining, and oil and gas extraction rose 28.1% in August as all types of activities grew.
Utilities declined 2.1% in August, following a 3.4% uptick in July when record heat across the country drove demand for utilities up for cooling purposes.
Both wholesale trade and retail trade rose by 0.4% in August, and were slightly above the pre-pandemic levels of activity, as subsectors in each of the sectors were evenly split between increases and decreases.
Sustainable development goals
On January 1, 2016, the world officially began implementing the 2030 Agenda for Sustainable Development—the United Nations' transformative plan of action that addresses urgent global challenges over the next 15 years. The plan is based on 17 specific sustainable development goals.
The release on gross domestic product by industry is an example of how Statistics Canada supports global sustainable development goal reporting. This release will be used to help measure the following goal:

Note to readers
Monthly data on gross domestic product (GDP) by industry at basic prices are chained volume estimates with 2012 as the reference year. This means that the data for each industry and each aggregate are obtained from a chained volume index multiplied by the industry's value added in 2012. The monthly data are benchmarked to annually chained Fisher volume indexes of GDP obtained from the constant-price supply and use tables (SUTs) up to the latest SUT year (2016).
For the period starting in January 2017, data are derived by chaining a fixed-weight Laspeyres volume index to the prior period. The fixed weights are 2016 industry prices.
This approach makes the monthly GDP by industry data more comparable with expenditure-based GDP data, which are chained quarterly.
All data in this release are seasonally adjusted. For information on seasonal adjustment, see Seasonally adjusted data – Frequently asked questions.
For more information on GDP, see the video "What is Gross Domestic Product (GDP)?"
Revisions
With this release of monthly GDP by industry, revisions have been made back to January 2019.
Each month, newly available administrative and survey data from various industries in the economy are integrated, resulting in statistical revisions. Updated and revised administrative data (including taxation statistics), new information provided by respondents to industry surveys, and standard changes to seasonal adjustment calculations are incorporated with each release.
Real-time table
Real-time table 36-10-0491-01 will be updated on November 9.
Next release
Data on GDP by industry for September will be released on December 1.
Products
The User Guide: Canadian System of Macroeconomic Accounts (13-606-G) is available.
The Methodological Guide: Canadian System of Macroeconomic Accounts (13-607-X) is also available.
The Economic accounts statistics portal, accessible from the Subjects module of the Statistics Canada website, features an up-to-date portrait of national and provincial economies and their structure.
Contact information
For more information, contact us (toll-free 1-800-263-1136; 514-283-8300; STATCAN.infostats-infostats.STATCAN@canada.ca).
To enquire about the concepts, methods or data quality of this release, contact Ederne Victor (613-863-6876), Industry Accounts Division.
- Date modified:


