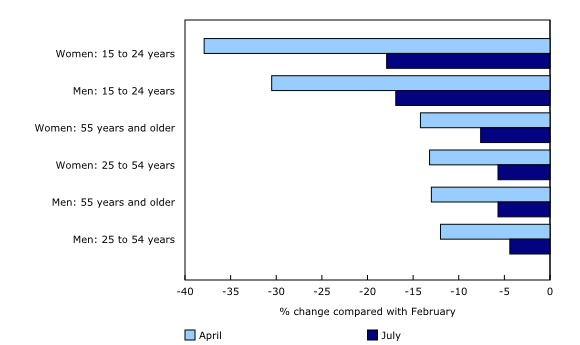
Chart 3
Employment for women further from pre-shutdown levels (change from February)

Source(s):
Statistics Canada, Labour Force Survey.
Chart description
This is a bar clustered chart.
| April | July | |
|---|---|---|
| Women: 15 to 24 years | -37.9 | -17.9 |
| Men: 15 to 24 years | -30.5 | -16.9 |
| Women: 55 years and older | -14.2 | -7.6 |
| Women: 25 to 54 years | -13.2 | -5.7 |
| Men: 55 years and older | -13.0 | -5.7 |
| Men: 25 to 54 years | -12.0 | -4.4 |
Source(s):
Statistics Canada, Labour Force Survey.
- Date modified: