Wholesale trade, March 2020
Archived Content
Information identified as archived is provided for reference, research or recordkeeping purposes. It is not subject to the Government of Canada Web Standards and has not been altered or updated since it was archived. Please "contact us" to request a format other than those available.
Released: 2020-05-20
$63.9 billion
March 2020
-2.2% 
(monthly change)
$351.6 million
March 2020
-1.0% 
(monthly change)
$96.9 million
March 2020
6.5% 
(monthly change)
$881.7 million
March 2020
-0.9% 
(monthly change)
$600.1 million
March 2020
0.6% 
(monthly change)
$11,995.6 million
March 2020
-1.2% 
(monthly change)
$33,289.5 million
March 2020
-3.2% 
(monthly change)
$1,586.1 million
March 2020
1.5% 
(monthly change)
$2,250.9 million
March 2020
6.4% 
(monthly change)
$6,504.3 million
March 2020
-1.5% 
(monthly change)
$6,222.4 million
March 2020
-3.6% 
(monthly change)
$12.8 million
March 2020
4.0% 
(monthly change)
$45.1 million
March 2020
3.5% 
(monthly change)
$16.0 million
March 2020
10.6% 
(monthly change)
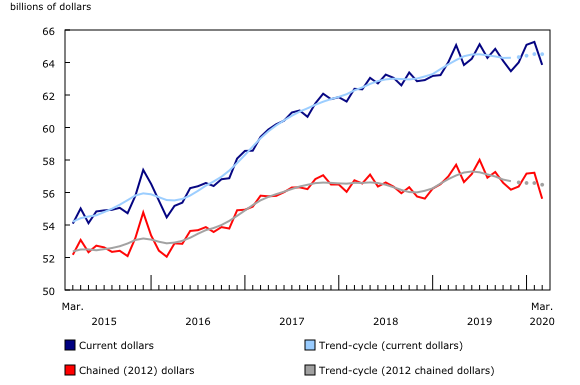
As the effects of the COVID-19 pandemic began to spread throughout the economy, wholesale sales fell 2.2% to $63.9 billion in March, following three consecutive monthly gains. Three of the seven subsectors recorded lower sales, accounting for 29% of total wholesale sales. In dollar terms, the motor vehicle and motor vehicle parts and accessories subsector contributed the most to the decline. Excluding this subsector, wholesale sales rose 2.1%.
In volume terms, wholesale sales dropped 2.8%.
In the first quarter of 2020, sales increased 1.4%, following a 1.4% decline in the fourth quarter of 2019. Higher sales were recorded in three of the seven subsectors, led by the food, beverage and tobacco subsector (+4.1%) and the miscellaneous subsector (+4.8%).
COVID-19 in March
Feedback from respondents highlighted the impact of the COVID-19 pandemic on sales and inventories in March 2020.
Over three-quarters (75.9%) of wholesalers saw their business activity impacted by the COVID-19 pandemic. The personal and household goods subsector (84.9%) reported the highest proportion of affected businesses, led by the home furnishings industry (90.0%) and the personal goods industry (87.4%). Lower sales volumes were caused by the mandatory closure of non-essential businesses. The pharmaceuticals and pharmacy supplies industry reported that 43.7% of businesses were affected by COVID-19. Many of these businesses were impacted positively, bolstered by bulk purchasing and abnormal buying patterns.
About four-fifths of the respondents in the motor vehicle and motor vehicle parts and accessories subsector reported the second-highest levels of business disruptions from COVID-19, led by the used motor vehicle parts and accessories industry (84.1%). These businesses noted that the impact to their sales was caused by the closure of non-essential operations.
Respondents reported that the COVID-19 pandemic caused sales to lower by $6.2 billion (unadjusted) in March. In dollar value, the motor vehicle and motor vehicle parts and accessories subsector was the most impacted by COVID-19, with an estimated $2.3 billion (unadjusted) loss in sales.
In terms of inventories, wholesalers reported an estimated reduction of $2.5 billion (unadjusted) because of COVID-19. Stock in the motor vehicle and motor vehicle parts and accessories subsector was drawn down by $1.3 billion in March, the largest reported decline.
Motor vehicle industry fuels lower sales in March
Lower sales were recorded in the motor vehicle and motor vehicle parts and accessories subsector, (-21.2% to $9.3 billion). This was the first decline in four months and the largest monthly percentage drop since January 2009. While all three industries in the subsector recorded declines in March, the motor vehicle industry accounted for about 93% of the decrease—down 24.1% to $7.4 billion. Quarterly sales in the motor vehicle and motor vehicle parts and accessories subsector fell for a third consecutive quarter; sales began to slow in the second half of 2019.
In March, the food, beverage and tobacco subsector posted its largest growth rate on record—up 8.1% to $13.3 billion. Gains were reported in two of the three industries, with the food industry contributing the most to the rise. On a quarterly basis, this subsector was up 4.1%, a seventh consecutive increase, and the largest quarterly growth rate since the fourth quarter of 2008.
Ontario motor vehicle subsector leads the declines
Sales declined in 6 of the 10 provinces, accounting for 93% of total wholesale sales in March. Ontario and British Columbia posted the largest decreases in monthly sales.
Ontario recorded a 3.2% decline to $33.3 billion in March, following three consecutive monthly increases. Five of the seven subsectors recorded higher sales in March, but those increases were offset by declines in the motor vehicle and motor vehicle parts and accessories subsector, which was down 22.9% to $6.6 billion. Excluding the motor vehicle and motor vehicle parts and accessories subsector, sales in Ontario rose 3.4%. Quarterly wholesale sales in Ontario increased 1.8% in the first quarter of 2020, despite the decline in March.
Sales in British Columbia decreased 3.6% to $6.2 billion, offsetting increases from the previous four months. Four of seven subsectors recorded lower sales, led by the motor vehicle and motor vehicle parts and accessories subsector (-18.0%) and the building material and supplies subsector (-5.0%). Wholesale sales in British Columbia rose 0.4% in the first quarter of 2020, following a 1.9% decline in the fourth quarter of 2019.
Wholesale inventories edge up in March
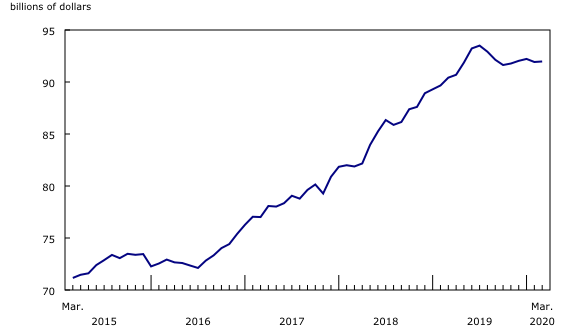
Wholesale inventories edged up 0.1% in March, to $92.0 billion. Higher inventories in five subsectors were almost entirely offset by lower inventories in the motor vehicle and motor vehicle parts and accessories subsector, and the personal and household goods subsector.
Higher inventories were led by the machinery, equipment and supplies subsector (+2.6% to $27.6 billion) and the building material and supplies subsector (+1.6% to $14.8 billion). All industries within these two subsectors reported higher inventories. The construction, forestry, mining, and industrial machinery, equipment and supplies industry (+2.4% to $13.0 billion) and the electrical, plumbing, heating and air-conditioning equipment and supplies industry (+3.5% to $4.4 billion) contributed the most to increases in their respective subsectors.
Inventories declined 5.3% to $12.6 billion in the motor vehicle and motor vehicle parts and accessories subsector, because of lower inventories in the motor vehicle industry (-8.7% to $7.4 billion). This was the lowest growth rate for this subsector since October 2003, when it declined 5.6%. The March decline brought the inventory level in this subsector to its lowest point since December 2018 and, combined with a 21.2% drop in sales, the inventory-to-sales ratio (1.35) reached its highest level since January 2009, when it was 1.37.
In the personal and household goods subsector, inventories declined 2.6% to $16.0 billion, mainly because of lower inventories in the pharmaceuticals and pharmacy supplies industry (-5.4% to $6.7 billion).
The overall inventory-to-sales ratio increased from 1.41 in February to 1.44 in March. The inventory-to-sales ratio is a measure of the time (in months) required to exhaust inventories if sales were to remain at their current level.
Looking forward: Impacts of COVID-19 on wholesale trade in April 2020
Statistics Canada remains committed to providing an accurate picture of the social and economic impacts of COVID-19.
As the largest component of Canada's services sector, wholesale trade impacts the whole economy while acting as the "invisible" intermediary.
Because April was the first full month of widespread quarantining, reported impacts on businesses for that month should be more severe than those reported in March.
Some industries, like the motor vehicle industry, were almost completely shut down as manufacturing facilities were closed and dealerships relied heavily on online sales.
The food industry suffered from a variety of negative events, including the shutdown of meat processing plants, which caused a plunge in processing capacity and impacted prices for live animals, especially pork. Dine-in restaurants were closed for the whole month of April, so lower sales of food wholesaling to restaurants can be expected compared with March. However, grocery sales were higher because of higher demand for food at grocery stores, and because food prices were up as consumers continued to stockpile.
Construction activity in most of Canada also ground to a halt. Sales of construction equipment and supplies are starting to suffer.
Note to readers
All data in this release are seasonally adjusted and expressed in current dollars, unless otherwise noted. For information on seasonal adjustment, see Seasonally adjusted data – Frequently asked questions.
Total wholesale sales expressed in volume are calculated by deflating current dollar values using relevant price indexes. The wholesale sales series in chained (2012) dollars is a chained Fisher volume index, with 2012 as the reference year. For more information, see Sales in volume for Wholesale Trade.
The Monthly Wholesale Trade Survey covers all industries within the wholesale trade sector, as defined by the North American Industry Classification System (NAICS), with the exception of oilseed and grain merchant wholesalers (NAICS 41112), petroleum and petroleum products merchant wholesalers (NAICS 412) and business-to-business electronic markets, and agents and brokers (NAICS 419).
For information on trend-cycle data, see the StatCan Blog and Trend-cycle estimates – Frequently asked questions.
Real-time data tables
Real-time data tables 20-10-0019-01, 20-10-0020-01 and 20-10-0005-01 will be updated soon.
Next release
Wholesale trade data for April will be released on June 18.
Products
The product "Monthly Wholesale Trade Survey: Interactive Tool" (71-607-X) is now available online. This product is based on the data published in the tables of the Monthly Wholesale Trade Survey: 20-10-0074-01, 20-10-0076-01 and 20-10-0003-01
Contact information
For more information, contact us (toll-free 1-800-263-1136; 514-283-8300; STATCAN.infostats-infostats.STATCAN@canada.ca). For analytical information, or to enquire about the concepts, methods or data quality of this release, contact John Burton (613-862-4878; john.burton@canada.ca), Mining, Manufacturing and Wholesale Trade Division.
- Date modified:


