Consumer Price Index, February 2020
Archived Content
Information identified as archived is provided for reference, research or recordkeeping purposes. It is not subject to the Government of Canada Web Standards and has not been altered or updated since it was archived. Please "contact us" to request a format other than those available.
Released: 2020-03-18
February 2020
2.2% 
(12-month change)
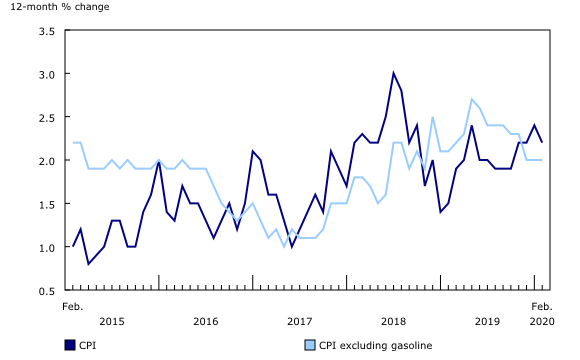
The Consumer Price Index (CPI) rose 2.2% on a year-over-year basis in February, down from a 2.4% gain in January. Excluding gasoline, the CPI rose 2.0%, matching the increase in December and in January.
On a seasonally adjusted monthly basis, the CPI rose 0.1% in February, matching the increase in January.
COVID-19 and the Consumer Price Index
Statistics Canada is closely monitoring possible impacts of the novel coronavirus (also known as COVID-19) on Canada's Consumer Price Index (CPI).
In February, several flights were suspended indefinitely in an effort to contain COVID-19. Although February airfares were collected prior to the suspension of flights, these prices were excluded from the CPI because passengers were ultimately unable to take these flights.
Since the beginning of March, further flight suspensions and travel advisories have been announced and various public events have been cancelled or postponed, which may lead to lower prices for travel services.
Crude oil prices have declined amid lower demand due to a slowdown in global economic activity and travel. Additionally, tensions between oil-producing nations are expected to lead to an increase in supply. These factors contributed to a price decline in early March, and could result in lower consumer gasoline prices in the coming months.
Because of these factors, as well as supply chain disruptions for consumer goods, temporary closures of some stores and service providers, the recent lowering of interest rates and the recent slowing of economic activity, the price effects of the outbreak could be more deeply felt in subsequent months.
Statistics Canada will continue to report the impacts of COVID-19 on consumer prices in Canada as information becomes available.
Two ways of exploring the Consumer Price Index (CPI)
Visit the Consumer Price Index Portal to find all CPI data, publications, interactive tools, and announcements highlighting new products and upcoming changes to the CPI in one convenient location.
Check out the Consumer Price Index Data Visualization Tool to access current and historical CPI data in a customizable, visual format.
Highlights
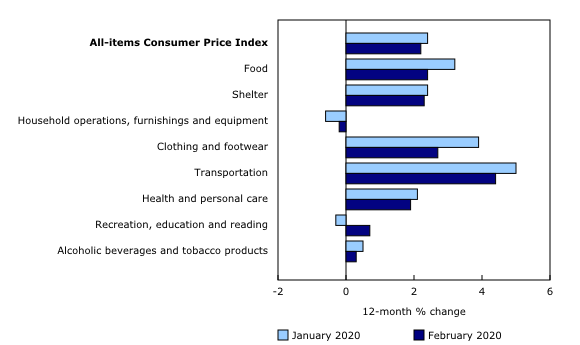
Prices rose in seven of eight major components on a year-over-year basis, with transportation (+4.4%) and shelter (+2.3%) prices contributing the most to the all-items increase. Year over year, prices for household operations, furnishings and equipment declined for the fifth consecutive month, largely due to lower prices for telephone services and household durable goods.
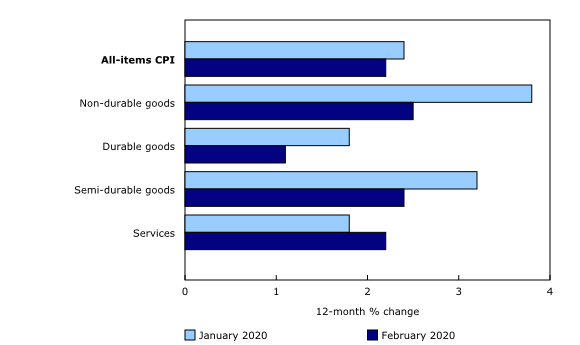
Year-over-year price growth for consumer goods slowed to 2.1% in February from 3.1% in January, while consumers paid more for services in February (+2.2%) than in January (+1.8%).
On a year-over-year basis, prices for gasoline rose less in February (+7.0%) than in January (+11.2%), reflecting lower crude oil prices amid lower global demand following the COVID-19 outbreak at the end of January. Likewise, consumers paid 1.3% less for fuel oil and other fuels, following an 8.1% increase in January.
Prices for fresh fruit and vegetables rose 1.6% in February, the smallest year-over-year increase since June 2018. Consumers paid less for oranges, reflecting lower farm prices for Florida oranges due to a decline in demand. Prices for apples continued to fall amid a North American oversupply due to foreign trade restrictions on American apples. Year-over-year growth in the fresh vegetables index (+3.3%) slowed in February, reflecting reports of a plentiful supply of cucumbers, lettuce and peppers.
Consumers paid 4.4% less for multipurpose digital devices, which includes smartphones and tablets, compared with February 2019. The decline reflects, in part, industry-wide promotional pricing prior to the introduction of new smartphone models.
Travel services lead the growth in service prices
Year over year, prices for travel tours rose 6.4% in February, following a decline in January. Higher demand for seasonal travel surrounding reading week at various postsecondary institutions and a statutory holiday Monday observed in several provinces contributed to the higher prices, which were collected from two to eight months in advance of February departures.
In February, prices for Internet access services rose 4.2% on a year-over-year basis. The increase followed 12 consecutive year-over-year declines beginning in February 2019, when several Internet service providers lowered plan prices or offered faster download speeds to consumers at the same cost.
Regional highlights
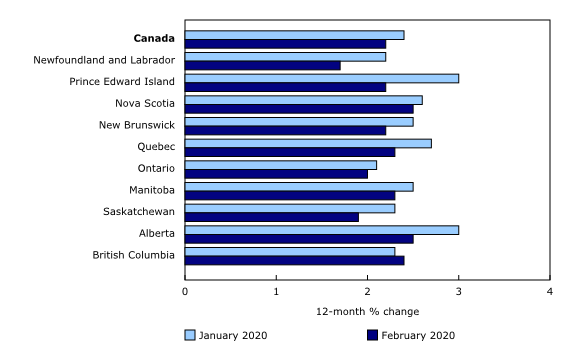
On a year-over-year basis, prices rose less in February than in January in nine provinces. In every province except British Columbia and Prince Edward Island, lower gasoline prices contributed the most to the slowdown.
Gasoline prices rose 1.7% month over month in British Columbia, where gas prices often trend differently than at the national level. Local reports suggest that this is largely due to the regional oil dynamics associated with the Pacific Northwest market.
Among the provinces, year-over-year price growth slowed the most in Prince Edward Island (+2.2%) and Newfoundland and Labrador (+1.7%). As crude oil prices declined, prices for fuel oil and other fuels fell the most in these provinces, where furnace oil is commonly used for home heating.
Note to readers
Cellular services index
The cellular services price index is now available upon request. For more information, contact us (toll-free 1-800-263-1136; 514-283-8300; STATCAN.infostats-infostats.STATCAN@canada.ca).
Real-time data tables
Real-time data table 18-10-0259-01 will be updated on March 30.
Next release
The Consumer Price Index for March will be released on April 22.
Products
The Consumer Price Index Data Visualization Tool is available on the Statistics Canada website.
More information about the concepts and use of the Consumer Price Index (CPI) is available in The Canadian Consumer Price Index Reference Paper (62-553-X).
For information on the history of the CPI in Canada, consult the publication Exploring the First Century of Canada's Consumer Price Index (62-604-X).
Two videos, "An Overview of Canada's Consumer Price Index (CPI)" and "The Consumer Price Index and Your Experience of Price Change," are available on Statistics Canada's YouTube channel.
Contact information
For more information, or to enquire about the concepts, methods or data quality of this release, contact us (toll-free 1-800-263-1136; 514-283-8300; STATCAN.infostats-infostats.STATCAN@canada.ca) or Media Relations (613-951-4636; STATCAN.mediahotline-ligneinfomedias.STATCAN@canada.ca).
- Date modified:


