Study: Canadian exports of goods to China by Canadian and Chinese provinces, 2016 to 2018
Archived Content
Information identified as archived is provided for reference, research or recordkeeping purposes. It is not subject to the Government of Canada Web Standards and has not been altered or updated since it was archived. Please "contact us" to request a format other than those available.
Released: 2020-02-18
China is one of Canada's largest merchandise trading partners and is an important market for Canadian businesses. Over 3,750 Canadian enterprises exported goods to China in 2018, an increase of more than 400 exporters from 2016. These enterprises, led by those from British Columbia, exported goods to nearly all provinces and regions in China during this period.
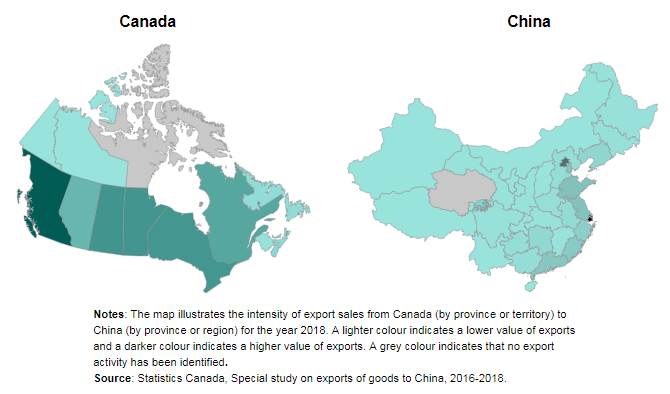
In 2018, Shanghai, Beijing, Hong Kong, Shandong and Jiangsu were the primary export destinations, accounting for nearly 70% of all identified exports to China ($21.3 billion) in the context of this study. Agri-food, motor vehicles, wood pulp and lumber were among the products most exported by Canadian businesses.
The purpose of this study is to gain a better understanding of the nature of the trade relationship between Canada and China. It sheds lights on various aspects of the trade activity between the two countries, such as the type and value of goods exported by Canadian provinces and territories, and by Chinese provinces and regions; and exporters' characteristics, for activity that occurred from 2016 to 2018.
Canadian exporters sell numerous products to a variety of destinations in China
Nearly 900 different products, based on the harmonized classification system at the 4-digit level, were exported to almost all provinces and regions in China in 2018, with the top 10 accounting for more than half of all identified exports.
Canadian exporters targeted a variety of destinations, which sometimes differed depending on the product exported. For example, canola and soybeans were the most in-demand products, with Shanghai, Beijing and Fujian as the primary destinations. Exports of lobster, crab, fish and other related products primarily targeted China's most populous regions, which included Shanghai, Shandong, Beijing and Guangdong. Most of the vehicles exported to China were cars destined to Tianjin and Jiangsu—two coastal provinces with different state-level economic and technological development zones.
Many Canadian exporters trade goods with China that originate outside Canada
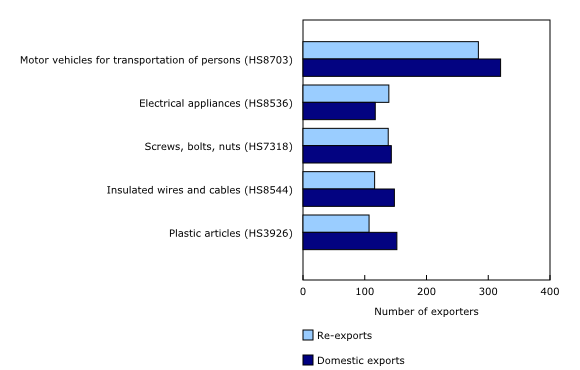
Of all the identified exports of goods to China in 2018, 96% originated in Canada (domestic exports), while the remainder of these exports originated in a foreign country and underwent some minor processing in Canada before being sold to China (re-exports). Even though re-exports were relatively small in terms of value, a significant share of exporters, nearly one-third, engaged in re-exporting activities with China in 2018.
In terms of products, re-exports involving the largest number of exporters were motor vehicles, electrical appliances and iron or steel products such as screws, bolts and nuts. Notably, there were more firms involved in re-exports of electrical appliances than in domestic exports of this product in 2018. The United States, Japan and Germany were among the main countries from which these goods originated.
Exports to China are highly concentrated
At the national level, the number of Canadian enterprises exporting goods to China increased from 3,340 in 2016 to 3,757 in 2018. Small and medium-sized enterprises with fewer than 10 employees were responsible for two-thirds of this increase.
In terms of export concentration, the 10 most important exporting enterprises accounted for nearly half of all export sales to China in 2018. The top 50 exporters—representing about 1.3% of all exporters—were responsible for nearly three-quarters of all export sales.
Export activity to China rises in most Canadian provinces
Exporter characteristics can also be analyzed by establishment. One enterprise can have multiple establishments operating in different provinces and industries.
On this basis, 3,808 establishments exported goods to China in 2018, up 12.3% from 2016. The largest increases were in Ontario (+165), followed by British Columbia (+98) and Quebec (+73). These increases were led by businesses with fewer than 50 employees.
British Columbia was the most important exporting province over the 2016-to-2018 period in terms of export values to China. Firms from British Columbia exported to nearly all Chinese provinces and regions except Qinghai and Tibet, and Beijing was the primary destination. In comparison, Saskatchewan had fewer exporters and they sold to fewer Chinese provinces.
Note to readers
This special study was conducted for Global Affairs Canada, with the goal of understanding patterns, clusters, and/or concentrations of commercial activity in different regions of China.
This release contains new data on Canadian exports by consignee province in China. It also contains information about the characteristics of Canadian businesses that sold goods to China.
In this study, the total value of exports corresponds to the part of the export value for which a Chinese province or region could be identified (referred to as identified exports in the text). Approximately 90% of all international merchandise transactions and 80% of all export values (customs basis) from 2016 to 2018 were identified. For example, the identified export value in 2018 was $21.3 billion, compared with $27.6 billion as per the Canadian International Merchandise (CIMT) program.
The terms merchandise exports, goods exports, export sales and Canadian exports are used interchangeably in this release.
Definitions
Chinese provinces and regions (provinces) include 23 provinces, 5 autonomous regions (Guangxi, Nei Mongol, Ningxia, Xinjiang Uygur, Tibet), 4 municipalities (Beijing, Chongqing, Shanghai and Tianjin), and the Special Administrative Regions of Hong Kong and Macau.
Consignee is the name and address of the party to which the cargo or goods are being shipped, as shown on the carrier's contract of carriage. It does not necessarily reflect the location where the goods are consumed.
Harmonized System (HS) refers to products classified at the HS2, HS4 or HS8 levels.
North American Industry Classification System (NAICS) Canada is used to classify companies and enterprises engaged in the production of goods and services using common definitions of the industrial structure.
Enterprise is the statistical unit that directs and controls the allocation of resources relating to its domestic operations and for which consolidated financial statements are maintained.
Establishment is the statistical unit for which the accounting data required to measure production are available (principal inputs, revenues, wages, etc.). Normally, the establishment or location of a company is responsible for producing the goods for export.
Small and medium enterprises have fewer than 500 employees, including those that did not report any employment. Large enterprises have 500 or more employees.
The Trade by Exporter Characteristics – Goods program is a Statistics Canada initiative that analyzes the business characteristics of exporters in Canada. These estimates are formed by linking customs trade data records to business entities in Statistics Canada's Business Register. The Business Register contains the complete operating and legal structure of enterprises operating in Canada, as well as their key characteristics, such as employment and NAICS code.
Domestic exports are goods grown, produced, extracted or manufactured in Canada, including goods of foreign origin that have been materially transformed in Canada.
Re-exports are goods of foreign origin that are exported either in the same condition in which they were originally imported into Canada or after undergoing some minor processing (e.g., blending, packaging, bottling, cleaning and sorting) that leave them essentially unchanged. The Business Number was used to determine the number of exporters who registered with the Canadian Border Services Agency (CBSA).
Data sources
1. Customs-based merchandise export transactions collected by CBSA for reference years 2016 to 2018.
2. Trade by Exporter Characteristics - Goods database, 2016 to 2018.
Methodology
Available upon request.
Contact information
For more information, or to enquire about the concepts, methods or data quality of this release, contact Angela Yuan-Wu (613-240-2871; angela.yuanwu@canada.ca) or Ying Di (613-867-2736; ying.di@canada.ca), International Accounts and Trade Division.
- Date modified:


