Canadian international trade in services, December 2019
Archived Content
Information identified as archived is provided for reference, research or recordkeeping purposes. It is not subject to the Government of Canada Web Standards and has not been altered or updated since it was archived. Please "contact us" to request a format other than those available.
Released: 2020-02-05
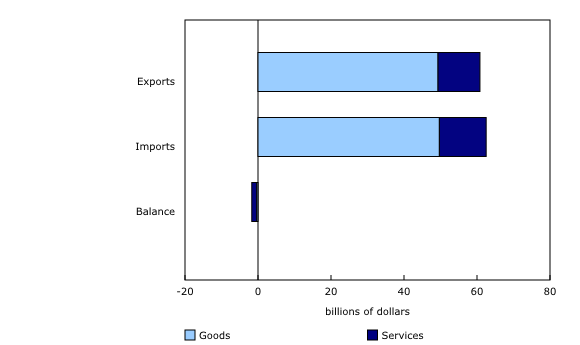
In December, Canada's monthly deficit in international trade in services narrowed by $153 million to $1.3 billion. The decreasing deficit was mainly due to a higher surplus for commercial services.
Imports of services declined $89 million to $12.8 billion in December, the result of lower payments for commercial services.
Exports increased $65 million to $11.5 billion, as travel services, commercial services, and transportation services all posted modest gains.
In comparison, total imports of goods were $49.7 billion in December, while exports totalled $49.3 billion, resulting in a goods deficit of $370 million. When combined, the trade balance for goods and services amounted to a deficit of $1.7 billion in December, down $979 million from November.
On an annual basis, the goods deficit narrowed from $22.1 billion in 2018 to $18.3 billion in 2019. The services deficit also trended down, from $21.4 billion in 2018 to $18.9 billion in 2019. The reduction was primarily due to an increased commercial services surplus, led by computer services.
The services trade deficit for November, first reported at $1.5 billion, was revised up by $15 million with this month's release of December data. Exports of services for November were revised down by $96 million, as both commercial services and travel services had downward revisions. Imports were revised down by $111 million, entirely on lower commercial services.
Note to readers
Revisions
The annual numbers referenced in this release are based on estimated values for the fourth quarter of 2019, and are subject to revision with the release of Canada's international balance of payments, fourth quarter 2019 on February 27, 2020.
With this release, seasonally adjusted data from 2007 to 2018 have been revised to ensure better alignment with the equivalent quarterly services data released as part of Canada's international balance of payments.
Data availability
These monthly trade in services estimates are available on a raw and on a seasonally adjusted basis for four principal categories of international services at the total country level: commercial services, travel, transport and government services.
The purpose of this new product is to provide more timely indicators on trade in services, supplementing the detailed quarterly and annual statistics on trade in services already included in the balance of payments. It will also provide a more comprehensive picture of Canada's overall international trade activity on a monthly basis, complementing the already published information on goods.
Previously, data were released on an experimental basis: "Experimental monthly estimates of international trade in services, September 2019."
Methodology
Because several data sources used in the compilation of the international trade in services program are only available on a quarterly or an annual basis, the monthly statistics on Canada's international trade in services are generated using models in cases where up-to-date information is not available. This is in keeping with the methodology used in many countries that produce monthly trade in services data.
In general, for most of the commercial services, travel, and some of the transport services, the modelling of monthly estimates follows a three-step approach. First, values for the upcoming quarter are estimated using statistical models (auto-regressive integrated moving average). Then, in a second step, indicator series proxying the monthly movement of trade in services are identified through relationships with other economic indicators, such as merchandise trade or gross domestic product by industry. Finally, a temporal disaggregation method (referred to as the Denton-Cholette method) is applied to distribute modelled quarterly services on a monthly basis using the predicted values of monthly services generated in the second step. Adjustments are made each month as new information is made available.
A more detailed description of estimation methodology for monthly trade in services is available upon request.
Products
The updated Canada and the World Statistics Hub (13-609-X) is available online. This product illustrates the nature and extent of Canada's economic and financial relationship with the world using interactive graphs and tables. This product provides easy access to information on trade, investment, employment and travel between Canada and a number of countries, including the United States, the United Kingdom, Mexico, China, Japan, Belgium, Italy, the Netherlands, and Spain.
The Methodological Guide: Canadian System of Macroeconomic Accounts (13-607-X) is available.
The User Guide: Canadian System of Macroeconomic Accounts (13-606-G) is also available. This publication will be updated to maintain its relevance.
Contact information
For more information, contact us (toll-free 1-800-263-1136; 514-283-8300; STATCAN.infostats-infostats.STATCAN@canada.ca).
To enquire about the concepts, methods or data quality of this release, contact Alec Forbes (613-668-6454; alec.forbes@canada.ca), International Accounts and Trade Division.
- Date modified:


