Stock and consumption of fixed capital, 2018
Archived Content
Information identified as archived is provided for reference, research or recordkeeping purposes. It is not subject to the Government of Canada Web Standards and has not been altered or updated since it was archived. Please "contact us" to request a format other than those available.
Released: 2019-11-19
The volume of Canada's non-residential and residential net capital stock increased 1.9% in 2018. In value terms, Canadian net capital stock totalled $5.1 trillion in 2018.
In Canada, net capital stock is relatively evenly split between non-residential capital stock (50.7% of the total) and residential capital stock (49.3%). The first asset grouping is comprised of non-residential buildings and engineering structures, machinery and equipment, and intellectual property products, while the second is made up of new residential construction, renovations to existing structures, and ownership transfer costs.
Non-residential capital stock
In volume terms, non-residential capital stock was up 1.1% in 2018, a similar pace to 2017 (+1.0%), and more than double the 0.4% growth seen in 2016.
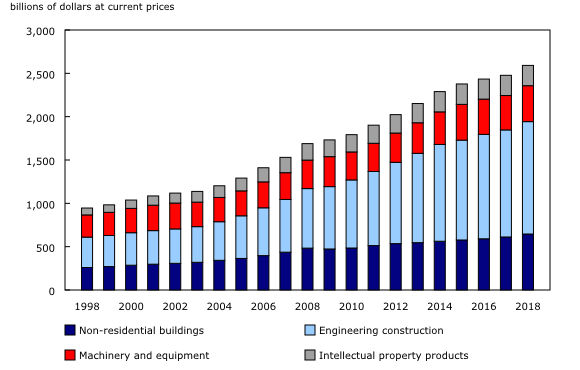
The stock of non-residential engineering construction rose 1.8% and was the biggest contributor to growth, despite having its lowest growth rate since 2002. The slowdown was mainly the result of the recent contraction in the oil and gas sub-sector. Transportation engineering construction, oil and gas production facilities and electric power engineering construction all showed gains, while declines in other oil and gas, waterworks, sewage and mining engineering construction tempered overall growth.
Meanwhile, the stock of non-residential buildings construction increased 0.6% in 2018. Within this asset grouping, schools, colleges, universities and other educational buildings posted a significant increase (+3.3%), while office buildings were down (-1.5%) as were shopping centres, plazas, malls and stores (-2.0%).
The stock of machinery and equipment increased 0.5% in 2018, the first increase in four years. For the second consecutive year, transportation equipment stock posted the most significant increase, rising 5.8%. Industrial machinery stock declined for a fourth consecutive year, falling 2.7% in 2018 from the previous year and by almost 12% since 2014.
The stock of intellectual property products was down 0.5% in 2018. Mineral exploration and evaluation led the decrease (-2.8%), posting its fifth annual decline. The stock of software increased for a ninth consecutive year in 2018 (+3.7%) following a gain of 4.2% in 2017.
A decrease in the capital stock occurs if depreciation is larger than the flow of new investment.
As was the case in the previous year, non-residential capital stock rose in most provinces and territories, declining only in Alberta and the Northwest Territories. Nunavut had the strongest growth at 10.2%, the result of back-to-back record increases in non-residential engineering construction, followed by Yukon (+5.8%), Manitoba (+2.4%), British Columbia (+2.1%) and Ontario (+2.1%).
Alberta's share of capital stock continues to shrink
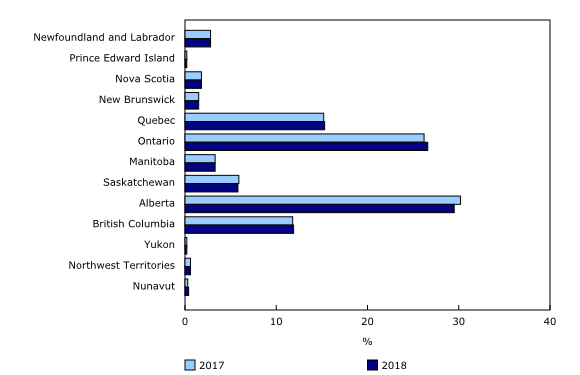
In 2018, Alberta continued to hold the largest share of non-residential capital stock in Canada at 29.5%, which is down from a share of 31.6% in 2014. It was Alberta's fourth straight year of declining share, the result of sustained lower investment in the oil and gas extraction sub-sector.
Saskatchewan was the only other province with a declining share of Canada's non-residential capital stock. Its share edged down to 5.8%.
In 2018, Ontario posted the largest increase in its share of Canada's non-residential capital stock, rising to 26.6%. The increase was mainly the result of strength in highway, roads, streets, bridges and overpasses and other transportation engineering construction.
In 2018, 25.4% of total non-residential capital stock in Canada was held by the government and non-profit sectors, a slight increase in share of 0.6% from 2017. A total of 27.1% was held by corporations in the mining, quarrying and oil and gas extraction industries, marking a fourth straight annual decline in share. These private sector industries accounted for 65.0% of non-residential capital stock in Nunavut, 64.5% in the Northwest Territories, 59.4% in Alberta, 47.3% in Newfoundland and Labrador, and 45.5% in Saskatchewan, with diminishing shares in each except Nunavut.
Residential capital stock
Residential capital stock rose 2.7% in 2018, similar to the previous two years (+2.8% each year). Overall, residential capital stock totalled $2.5 trillion in value in 2018. Over two-thirds represented the stock of new homes, while the remaining one-third represented renovations to existing residential structures.
Every province and territory posted a gain in volume of residential capital stock in 2018. On a percentage basis, these increases were led by British Columbia (+4.9%), followed by Prince Edward Island (+4.3%) and Manitoba (+3.0%). Prince Edward Island's growth was its highest since 2004 and was dominated by new housing.
Note to readers
This release reflects revised estimates of investment flows and prices in accordance with the latest revision of the Canadian System of Macroeconomic Accounts.
The classification of non-residential capital stock is based on the final demand classification used in the Supply and Use tables.
Estimates of non-residential and residential investment, depreciation and the associated net stocks are available by geographical breakdown on a current price basis, 2012 constant price basis (2012 asset price = 100) and chained (2012) dollar basis. Non-residential estimates of depreciation and stock are available by industry and by asset, using linear, geometric and hyperbolic methods. Residential estimates are available by type of investment using geometric methods.
Products
The data visualization product "Infrastructure Statistics Hub," which is part of Statistics Canada – Data Visualization Products (71-607-X), is available.
The Latest Developments in the Canadian Economic Accounts (13-605-X) is available.
The User Guide: Canadian System of Macroeconomic Accounts (13-606-G) is also available.
The Methodological Guide: Canadian System of Macroeconomic Accounts (13-607-X) is also available.
Contact information
For more information, or to enquire about the concepts, methods or data quality of this release, contact us (toll-free 1-800-263-1136; 514-283-8300; STATCAN.infostats-infostats.STATCAN@canada.ca) or Media Relations (613-951-4636; STATCAN.mediahotline-ligneinfomedias.STATCAN@canada.ca).
- Date modified:


