
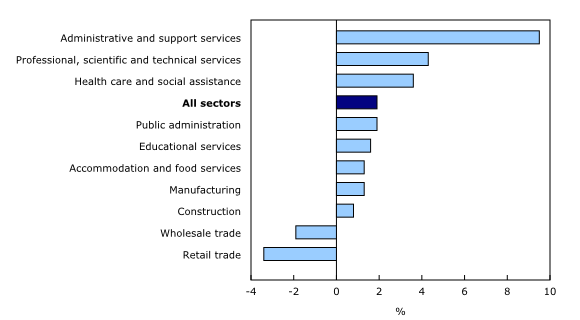
Chart 2
Year-over-year change in average weekly earnings in the 10 largest sectors, March 2019
Source(s):
Table 14-10-0220-01 (formerly CANSIM table 281-0047).
Chart description
This is a bar clustered chart.
| % | |
|---|---|
| Administrative and support services | 9.5 |
| Professional, scientific and technical services | 4.3 |
| Health care and social assistance | 3.6 |
| All sectors | 1.9 |
| Public administration | 1.9 |
| Educational services | 1.6 |
| Accommodation and food services | 1.3 |
| Manufacturing | 1.3 |
| Construction | 0.8 |
| Wholesale trade | -1.9 |
| Retail trade | -3.4 |
Source(s):
Table 14-10-0220-01 (formerly CANSIM table 281-0047).
- Date modified: