Study: Economic well-being across generations of young Canadians: Are millennials better or worse off?
Archived Content
Information identified as archived is provided for reference, research or recordkeeping purposes. It is not subject to the Government of Canada Web Standards and has not been altered or updated since it was archived. Please "contact us" to request a format other than those available.
Released: 2019-04-18
Millennials had higher incomes and median wealth than young Gen-Xers at the same age, but also considerably more mortgage debt
Examining debt and wealth for young households, who have begun to accumulate assets and debt over a period of sustained home price inflation, provides another perspective on the health of balance sheets in Canada. A new Statistics Canada study compares financial outcomes for millennials with those of Gen-Xers when they were at the same age.
The study suggests that while millennials were wealthier than young Gen-Xers, they were also more indebted, reflecting higher levels of mortgage debt. Major differences were observed among millennials, as those who invested in the housing market, or were living in Toronto or Vancouver were considerably better off. The study is part of a series aimed at providing information on debt and wealth across the country.
Millennials had higher incomes and median wealth than Gen-Xers at the same age
Over the last decade, millennials pursued postsecondary studies and began to enter the labour market. The study finds that millennials—the most educated generation—had higher household incomes than Gen-Xers or baby boomers when they were the same age. Specifically, household incomes reached $66,500 for millennials aged 25 to 34 in 2016, compared with $51,000 for young Gen-Xers at the same age in 1999.
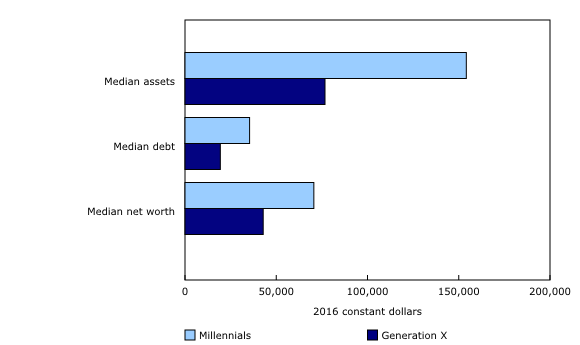
Higher incomes suggest different potentials for saving and wealth accumulation. Median net worth—meaning total household assets minus total debts—was higher for millennials than for young Gen-Xers. Median net worth reached $70,600 for millennials, over one and a half times the level for young Gen-Xers ($42,800). To accumulate wealth, households typically take on both assets and debts over their life course. Although millennials were better off than young Gen-Xers in terms of assets or median wealth, they were relatively more indebted, as they carried considerably more mortgage debt.
Millennials carried more than 200% of their after-tax incomes in debt
Debt-to-income ratios are a key financial indicator and provide information on the ability of households to service debt from their current income. The debt to after-tax income ratio reached 216% for millennials, far exceeding the 125% for young Gen-Xers or 80% for young boomers.
Mortgage debt over 2.5 times the value of after-tax incomes for millennials
Even during a sustained period of home price inflation, millennials continued to enter the housing market at the same pace as previous generations. The study shows that among millennials aged 30 to 34, when households typically enter the housing market, about 51% had invested in a home, or had a principal residence as part of their asset portfolio, comparable to young Gen-Xers (51%) and young boomers (55%).
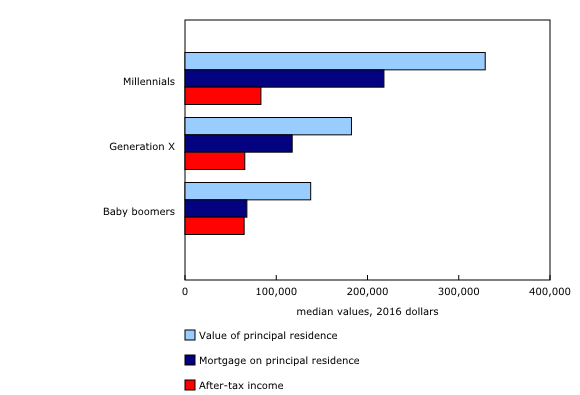
Though homeownership rates were similar across young generations, millennials who entered the housing market took on considerably more mortgage debt. Median mortgage debt for millennials aged 30 to 34 reached $218,000, over 2.5 times the value of their median after-tax income ($83,200). By contrast, mortgage debt for young boomers ($67,800) was equivalent to their after-tax income. Similar patterns were observed for principal residence asset values across young generations, which were considerably higher for millennials than for young Gen-Xers and for young boomers.
Major differences in wealth for millennials
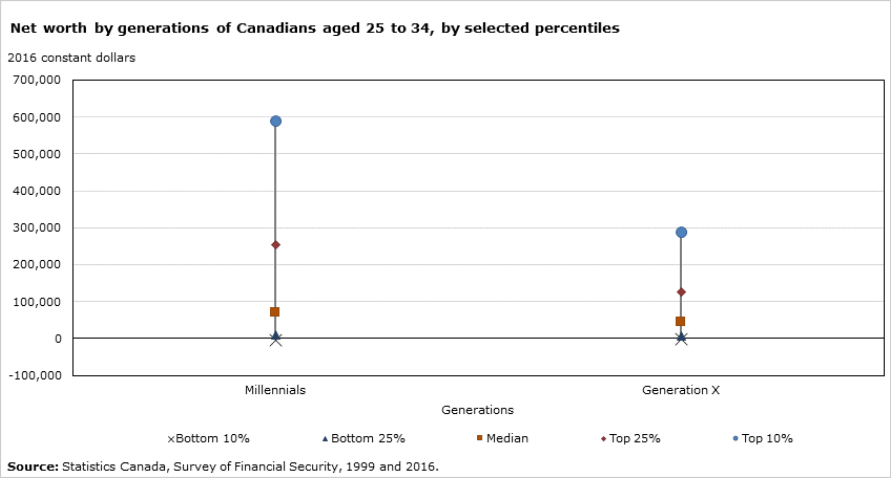
Major differences in wealth were observed among various groups of millennials, more so than for young Gen-Xers. The gap between the wealthiest and the poorest widened from one generation to the next. For example, net worth for millennials in the bottom 25% was $9,500, relative to $253,900 for those in the top 25%. In comparison, the corresponding difference in net worth among young Gen-Xers ranged from $6,200 to $126,900. Millennials in the top 10% had accumulated $588,600 in net worth and even more, they held 55% of the total wealth for their generation.
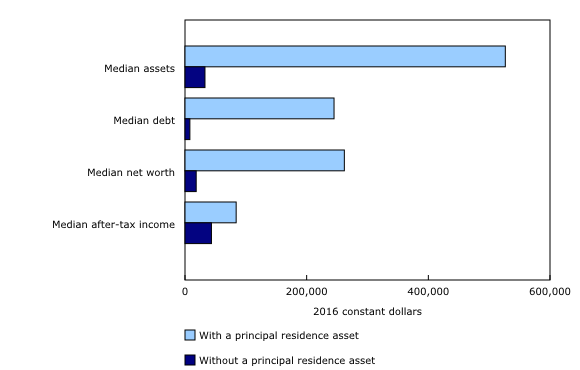
Millennials who invested in the housing market were considerably better off than those who did not. Median wealth for millennial homeowners aged 30 to 34 reached $261,900, compared with $18,400 for those who did not invest in housing. Millennials with a university education were also in a stronger financial position, as their median wealth was $116,000, relative to $34,100 for those with a high school degree or less.
Economic well-being also varied across the country, as millennials living in Vancouver and Toronto had higher net worth. Median net worth reached $145,000 for millennials in Toronto and $91,000 for those in Vancouver. These disparities were even more pronounced at the top of the net worth distribution, as millennials in the top 10% in Vancouver or Toronto had accumulated nearly $1 million in net worth. These findings again reflect differences in housing values, as principal residence asset values reached $650,000 in Vancouver and Toronto, more than double the levels observed at the national level ($320,000).
Note to readers
To compare assets, debts and net worth of young generations, this study uses data from the 1999 and 2016 Survey of Financial Security (SFS) and from the Assets and Debt Survey (ADS) for 1984. For the same years, data from the Canadian Income Survey are used to estimate household income adjusted for family size. Given that data on assets, debts and net worth are collected on a household basis, characteristics such as "generation," age or educational attainment are determined using information from the major income earner in the household.
To compare key financial indicators across young generations, households where the major income earner was between 25 and 34 years old were selected in the ADS (1984) and the SFS (1999 and 2016). As such, for the purpose of this study, millennials are defined as those aged 25 to 34 in 2016 (those born from 1982 to 1991). Young Gen-Xers are defined as those aged 25 to 34 in 1999 (those born from 1965 to 1971). Finally, young boomers are defined as those aged 25 to 34 in 1984 (those born from 1950 to 1961).
More information on data and methodology is provided in the full study.
Products
The research article "Economic Well-being Across Generations of Young Canadians: Are Millennials Better or Worse Off?," which is part of Economic Insights (11-626-X), is now available.
Also released today is an infographic titled "Wealth and debt: How are millennials doing?," which provides a comparison of key financial indicators for millennials and Gen-Xers when they were at the same age. Also available is the video "StatCan Research Beat: Economic well-being across generations: Are millennials better or worse off?," which provides a brief overview of key takeaways from this study.
Contact information
For more information, contact us (toll-free 1-800-263-1136; 514-283-8300; STATCAN.infostats-infostats.STATCAN@canada.ca).
To enquire about the concepts, methods or data quality of this release, contact Elizabeth Richards (613-863-4623; Elizabeth.richards@canada.ca), Analytical Studies Branch, or Andrew Heisz (613-951-6429; Andrew.Heisz@canada.ca), Income Statistics Division.
- Date modified:


