National balance sheet and financial flow accounts, fourth quarter 2018
Archived Content
Information identified as archived is provided for reference, research or recordkeeping purposes. It is not subject to the Government of Canada Web Standards and has not been altered or updated since it was archived. Please "contact us" to request a format other than those available.
Released: 2019-03-14
National wealth decreases as a result of declines in natural resources and real estate
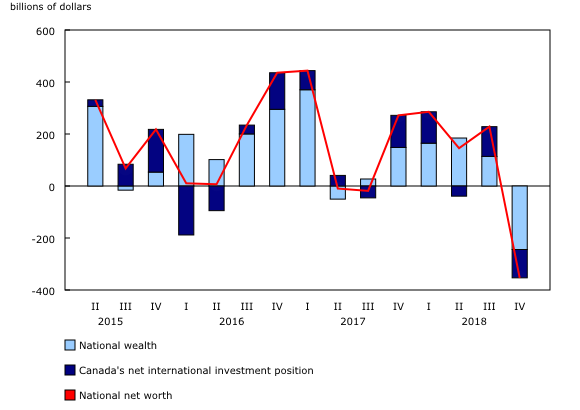
National wealth, the value of non-financial assets in the Canadian economy, declined 2.2% to $11,080.6 billion at the end of the fourth quarter. This was primarily due to a 23.5% decrease in the value of natural resources. The value of natural resources was affected by weaker crude oil prices in the fourth quarter, which have more recently rebounded in the first two months of 2019. A decline in the value of residential real estate (-$72.5 billion) also contributed to the fourth quarter decrease, as housing prices continued to edge down. On a per capita basis, national wealth fell from $304,085 to $296,933.
Canada's net foreign asset position decreased by $109.1 billion to $528.6 billion in the fourth quarter, after reaching a record high of $637.7 billion at the end of the third quarter. This decline mainly reflected the weaker performance of foreign stock markets relative to the Canadian stock market, which lowered the value of Canada's international assets in equity instruments relative to international liabilities.
National net worth, the sum of national wealth and Canada's net foreign asset position, decreased 3.0% to $11,609.2 billion at the end of the fourth quarter.
Household residential real estate continues to fall
The household sector's net worth declined 2.8% to $10,735.6 billion in the fourth quarter. This was mainly the result of a lower market value for financial assets (-3.2%), which was led by a 7.5% decrease in the value of equity and investment fund shares. Weaker domestic and foreign stock markets, especially toward the end of the quarter, were a major factor behind the decrease; however, the first two months of 2019 have shown signs of recovery.
The value of non-financial assets fell 1.0% to $6,187.1 billion in the fourth quarter, led by a 1.4% decline in the value of residential real estate. This was the weakest quarter for residential real estate since the fourth quarter of 2008. The value of residential real estate posted its first annual decrease in 2018 since the start of the time series. Total sales of residential real estate fell 14.7% in 2018.
The decline in household assets and the increase in liabilities (+0.9%) resulted in a rise in the debt-to-asset ratio, which reached 17.3% in the fourth quarter. The ratio of household financial assets to non-financial assets declined to 109.8% in the fourth quarter, as financial assets fell at a faster pace.
Seasonally adjusted household borrowing up slightly
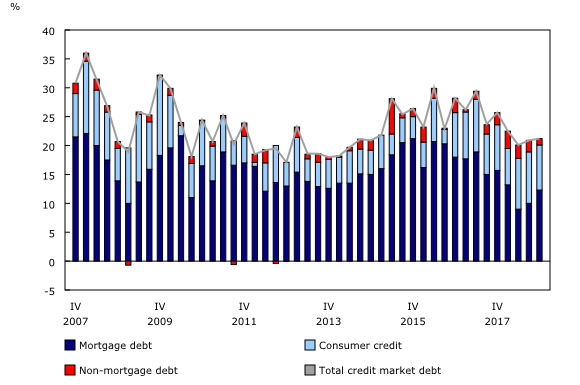
On a seasonally adjusted basis, total credit market borrowing edged up in the quarter compared with the previous quarter, as households borrowed $21.2 billion. While demand for consumer credit and non-mortgage loans was down, mortgage loan demand rose $2.3 billion to $12.3 billion. Despite the increase in the fourth quarter, on an annual basis, household credit market borrowing was down 19.5% to $84.6 billion in 2018, the lowest level of borrowing since 2014.
Credit market debt (consumer credit, and mortgage and non-mortgage loans) totalled $2,209.3 billion in the fourth quarter. Mortgage debt reached $1,439.9 billion, while consumer credit and non-mortgage loans combined stood at $769.4 billion.
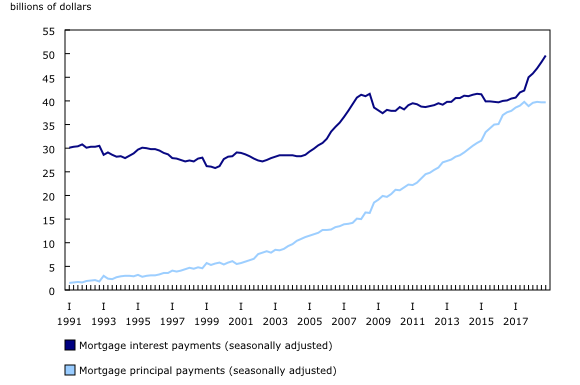
The household debt service ratio, measured as total obligated payments of principal and interest on credit market debt as a proportion of household disposable income, increased to 14.9% in the fourth quarter, as growth in total debt payments outpaced the growth in disposable income.
Household credit market debt as a proportion of household disposable income increased to 178.5% in the fourth quarter, with growth in debt slightly outpacing income growth. In other words, there was $1.79 in credit market debt for every dollar of household disposable income.
Federal government borrowing slows
The federal government demand for credit market debt was $3.6 billion in the fourth quarter. This included $2.1 billion in net issuances of bonds and $1.1 billion in net issuances of short-term paper. On an annual basis, the federal government demanded $5.9 billion of funds in 2018, a sharp decrease from $17.0 billion in 2017. This decline was accentuated by $4.2 billion in net retirements of bonds, the first such annual occurrence since 2007. Over the course of 2018, non-residents recorded $38.5 billion of net sales and redemptions of federal government bonds.
The demand for funds by other levels of government totalled $10.6 billion in the fourth quarter, most of which was in the form of net issuances of bonds and debentures (+$5.4 billion). In 2018, other levels of government demanded $44.6 billion, up slightly from $43.1 billion in 2017.
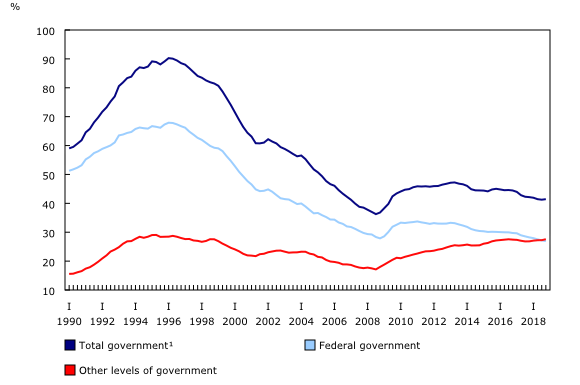
Despite slower economic growth in 2018, the ratio of federal government net debt (book value) to gross domestic product (GDP) improved to 26.9% in the fourth quarter, as federal government borrowing slowed more than GDP. The ratio of other government net debt (book value) to GDP surpassed the federal government ratio for the second consecutive quarter, edging up from 27.3% in the third quarter to 27.6% in the fourth quarter.
Demand for funds by non-financial private corporations accelerates
The demand for funds by non-financial private corporations was $46.5 billion in the fourth quarter, up from $32.4 billion in the third quarter. Throughout the year, non-financial private corporations posted strong demand for non-mortgage loans. On an annual basis, demand for funds by non-financial private corporations totalled $165.1 billion in 2018, down from $193.5 billion in 2017.
Non-financial private corporations' debt-to-equity ratio (book value) edged up in the fourth quarter to 72.2%. Over the course of 2018, non-financial private corporations' debt-to-equity ratio increased by 4.7 points.
Financial sector mortgage financing slowdown continues
The financial sector injected $43.5 billion of funds into the economy through financial market instruments in the fourth quarter, down from $85.9 billion in the third quarter. Fourth quarter financing was mostly attributable to non-mortgage (+$28.8 billion) and mortgage (+$15.5 billion) loans, with chartered banks providing most of these funds to non-financial private corporations and households.
Among financial corporations, the decline in stock market prices also affected the market value of financial assets, which fell 1.1% in the fourth quarter to $14,043.3 billion. This decrease was attributable to downward revaluations and other volume changes of $326.6 billion, mainly in equity. Institutional investors, such as trusteed pension plans, mutual funds, segregated funds and life insurance, recorded these downwards revaluations. This impact was also felt in the household sector, as households hold a large share of equity in these institutions.
Note to readers
This release of the financial and wealth accounts comprises the national balance sheet accounts (NBSA), financial flow accounts (FFA) and other changes in assets accounts.
The NBSA are composed of the balance sheets of all sectors and subsectors of the economy. The main sectors are households, non-profit institutions serving households, financial corporations, non-financial corporations, government and non-residents. The NBSA cover all national non-financial assets and financial asset-liability claims outstanding in all sectors. To improve the interpretability of financial flows data, selected household borrowing series are available on a seasonally adjusted basis (table 38-10-0238-01). All other data are unadjusted for seasonal variation. For information on seasonal adjustment, see Seasonally adjusted data – Frequently asked questions.
The FFA articulate net lending or borrowing activity by sector by measuring financial transactions in the economy. The FFA arrive at a measure of net financial investment, which is the difference between transactions in financial assets and liabilities (for example, net purchases of securities less net issuances of securities). The FFA also provide the link between financial and non-financial activity in the economy, which ties estimates of saving and non-financial capital acquisition (for example, investment in new housing) to the underlying financial transactions.
While the FFA record changes in financial assets and liabilities between opening and closing balance sheets that are associated with transactions during the accounting period, the value of assets and liabilities held by an institution can also change for other reasons. These other types of changes, referred to as other economic flows, are recorded in the other changes in assets account.
There are two main components to this account. One is the other changes in the volume of assets account. This account includes changes in non-financial and financial assets and liabilities relating to the economic appearance and disappearance of assets, the effects of external events such as wars or catastrophes on the value of assets, and changes in the classification and structure of assets. The other main component is the revaluation account, showing holding gains or losses accruing to the owners of non-financial and financial assets and liabilities during the accounting period as a result of changes in market price valuations.
At present, only the aggregate other change in assets is available within the Canadian system of macroeconomic accounts; no details are available on the different components.
Definitions concerning financial indicators can be found in Financial indicators from the National Balance Sheet Accounts and in the system of macroeconomic accounts glossary.
Revisions
This fourth quarter release of the national balance sheet and financial flow accounts includes revised data from the first quarter to the third quarter of 2018. These data incorporate new and revised data, as well as updated data on seasonal trends.
Additionally, this release incorporates revisions to specific time series from the first quarter of 1990 to the third quarter of 2018, resulting from the inclusion of legal and illegal economic activities related to cannabis for non-medical and medical use into national accounts time series back to 1961. For this release, revisions were limited to the FFA, where net lending and other components of the capital account were revised, as well as to specific financial indicators that used either disposable income or gross domestic product in their calculation, both of which were revised.
In the near future, data enhancements to the national balance sheet and financial flow accounts will be incorporated, such as the development of detailed counterparty information by sector. To facilitate this initiative and others, it is necessary to extend the annual revision period (normally the previous three years) at the time of the third quarter release. As such, for the next two years, with the third quarter release of the financial and wealth accounts, data will be revised back to 1990 to ensure a continuous time series.
Understanding business credit loan measures
The Bank of Canada and Statistics Canada conducted a joint study to understand and identify key differences between their respective measures of business credit loans, including non-mortgage business loans, non-residential mortgages and commercial paper. Updated reconciliation tables for these items are now available in table 38-10-0619-01.
Seasonally adjusted stocks of household credit market debt
Seasonally adjusted stocks of household credit market debt, in addition to seasonally adjusted financial flows, are now included in the quarterly release of the financial and wealth accounts in table 38-10-0238-01.
In the third quarter of 2018, new data on seasonally adjusted ratios of credit market debt to personal disposable income were introduced. Please see "Seasonal adjustment of stocks and flows in the Financial and Wealth Accounts: towards an integrated approach" for more information on the data sources and methodologies.
Financial and wealth accounts on a from-whom-to-whom basis: Selected financial instruments
The data visualization product "Financial accounts on a from-whom-to-whom basis, selected financial instruments" has been updated with data from the first quarter to the fourth quarter of 2018.
Next release
Data on the national balance sheet and financial flow accounts for the first quarter will be released on June 13.
Products
The data visualization product "Financial accounts on a from-whom-to-whom basis, selected financial instruments," which is part of Statistics Canada— Data Visualization Products (71-607-X), is now available.
The document "Understanding business credit measures: a joint study by the Bank of Canada and Statistics Canada," which is part of Latest Developments in the Canadian Economic Accounts (13-605-X), is available.
The document "Seasonal adjustment of stocks and flows in the Financial and Wealth Accounts: towards an integrated approach," which is part of Latest Developments in the Canadian Economic Accounts (13-605-X), is available.
The Latest Developments in the Canadian Economic Accounts (13-605-X) is available.
The User Guide: Canadian System of Macroeconomic Accounts (13-606-G) is available.
The Methodological Guide: Canadian System of Macroeconomic Accounts (13-607-X) is available.
Contact information
For more information, or to enquire about the concepts, methods or data quality of this release, contact us (toll-free 1-800-263-1136; 514-283-8300; STATCAN.infostats-infostats.STATCAN@canada.ca) or Media Relations (613-951-4636; STATCAN.mediahotline-ligneinfomedias.STATCAN@canada.ca).
- Date modified:


