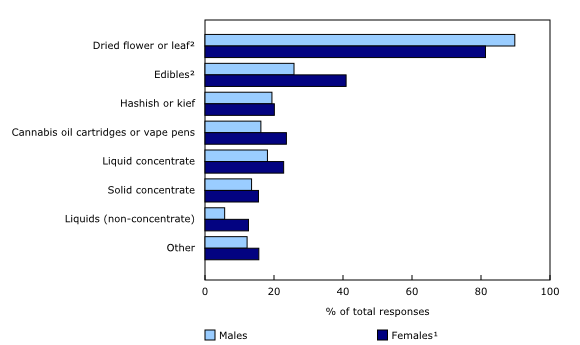
Chart 1
Percentage reporting use of each cannabis product in the past three months by gender, household population aged 15 years or older, Canada, second quarter of 2018

1.
Reference category.
2.
Significantly different from reference category (p<0.05).
Source(s):
National Cannabis Survey (5262).
Chart description
This is a bar clustered chart.
| Males | Females¹ | |
|---|---|---|
| Dried flower or leaf² | 89.8 | 81.3 |
| Edibles² | 25.8 | 40.9 |
| Hashish or kief | 19.4 | 20.1 |
| Cannabis oil cartridges or vape pens | 16.2 | 23.6 |
| Liquid concentrate | 18.1 | 22.8 |
| Solid concentrate | 13.5 | 15.5 |
| Liquids (non-concentrate) | 5.7 | 12.6 |
| Other | 12.2 | 15.6 |
1.
Reference category.
2.
Significantly different from reference category (p<0.05).
Source(s):
National Cannabis Survey (5262).
- Date modified: