
Chart 5
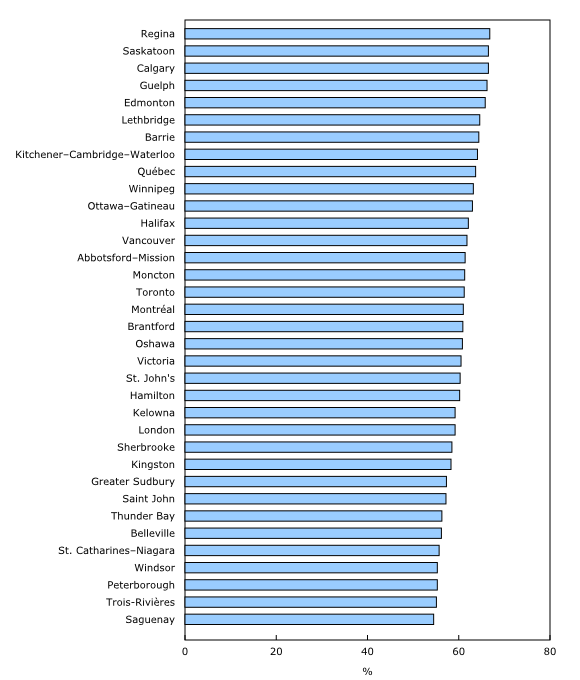
Employment rate, by census metropolitan area, highest to lowest, Canada, 2016
Source(s):
Statistics Canada, Census of Population, 2016.
Chart description
This is a bar clustered chart.
| % | |
|---|---|
| Regina | 66.8 |
| Saskatoon | 66.5 |
| Calgary | 66.5 |
| Guelph | 66.2 |
| Edmonton | 65.8 |
| Lethbridge | 64.6 |
| Barrie | 64.4 |
| Kitchener–Cambridge–Waterloo | 64.1 |
| Québec | 63.7 |
| Winnipeg | 63.2 |
| Ottawa–Gatineau | 63.0 |
| Halifax | 62.1 |
| Vancouver | 61.8 |
| Abbotsford–Mission | 61.4 |
| Moncton | 61.3 |
| Toronto | 61.2 |
| Montréal | 61.0 |
| Brantford | 60.9 |
| Oshawa | 60.8 |
| Victoria | 60.5 |
| St. John's | 60.3 |
| Hamilton | 60.2 |
| Kelowna | 59.2 |
| London | 59.2 |
| Sherbrooke | 58.5 |
| Kingston | 58.3 |
| Greater Sudbury | 57.3 |
| Saint John | 57.2 |
| Thunder Bay | 56.3 |
| Belleville | 56.2 |
| St. Catharines–Niagara | 55.7 |
| Windsor | 55.3 |
| Peterborough | 55.3 |
| Trois-Rivières | 55.1 |
| Saguenay | 54.5 |
Source(s):
Statistics Canada, Census of Population, 2016.
- Date modified: